Friday 1 April 2011

SPX Daily Chart - 31 March 2011

     After coming very near our next target level of 1332.28 on Wednesday, the market hesitated yesterday as it formed what it known as an 'inside' day. At the same time it completed a TD Sell Setup. Decision time!
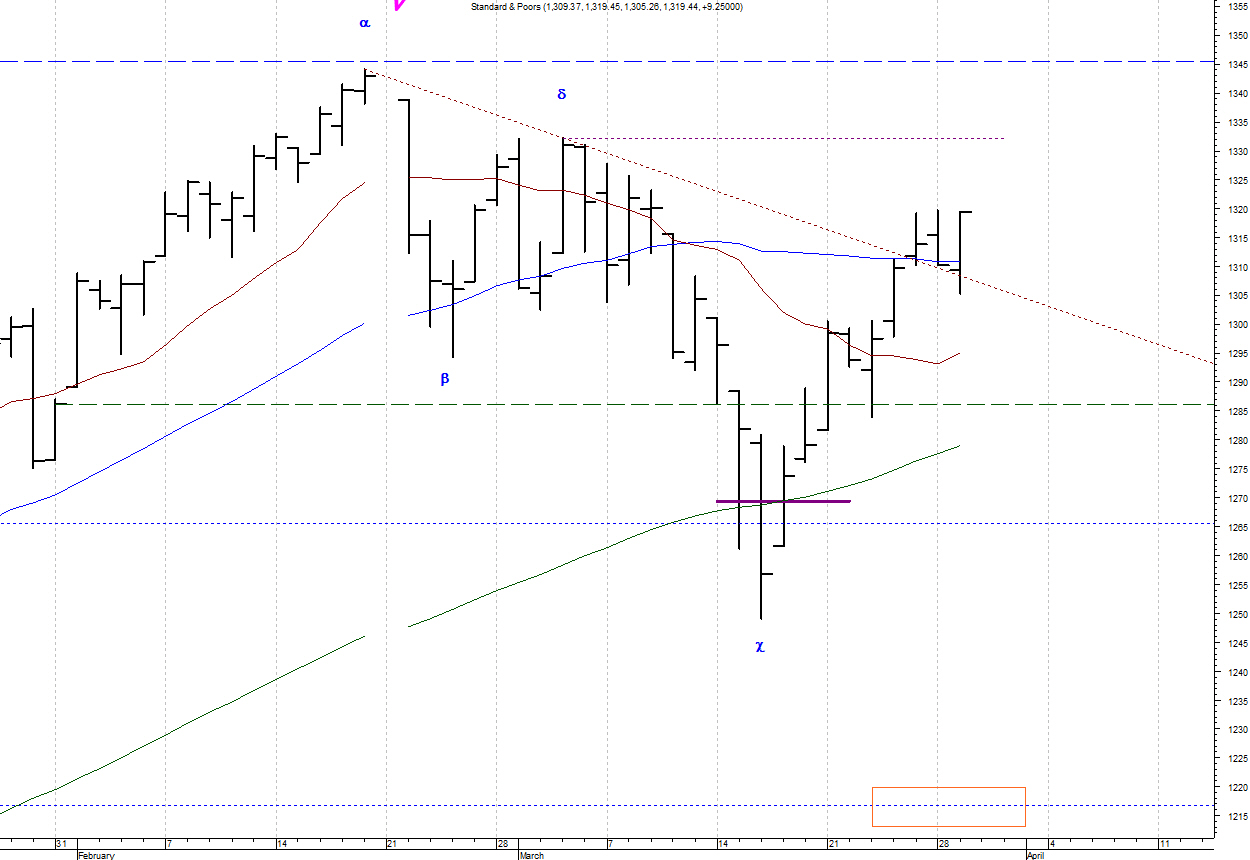
     To get an early indication of which way we go from here I will be observing the price action with regard to two 'lines'. The question is which one will the market break first (in a qualified manner): the 1332.28 resistance level (horizontal dashed line on the chart) or the demand line (upsloping dashed green line)? A qualified break of the former says we next challenge 1345.5. A qualified break of the latter says the run up from March 16 is likely over.
     Another point of interest that I will be watching on all the charts to come (new Quarterly, Monthly, and Weekly to be presented starting Monday): What is the RSI indicator saying in its role as a trend indicator? On the daily chart it said a bear market began at the mid-February high. In fact, the current rally sees the RSI still below the area reserved for resistence in bear markets (shown by the parallel red horizontal lines).
     Bottom Line: The daily chart remains in a bearish mode with allocation mix at a +50% reading. The chart would turn bullish with a qualified break of 1345.5.

Thursday 31 March 2011

SPX Daily Chart - 30 March 2011

     As the market approaches the next target level of 1332.28 it looks as if it will also complete a TD Sell Setup today. Decision time! Will the run upwards continue through a full sequential and/or combo countdown? Or will setup mark a top?
     Bottom Line:The daily chart remains in a bearish mode with allocation mix at a +50% reading. The chart would turn bullish with a qualified break of 1345.5.

Wednesday 30 March 2011

SPX Daily Chart - 29 March 2011

     The price action over the past few days can be characterized as consolidation after a qualified break of the alpha-delta trend line (downsloping dashed red line). As indicated on the chart the next upside target level is 1332.28.
     Of new interest is the growing possibility that a new TD Sell Setup will be completed at the close tomorrow (Thursday). If the current 'y' pulse rally is going to end soon that is a good 'time' for it to do so.
     Bottom Line:The daily chart remains in a bearish mode and hence there is no need for me to adjust my allocation mix which stands at a +50% reading. What would turn this chart bullish? A qualified break of 1345.5, and I don't expect that to happen within the near term.

Tuesday 29 March 2011

SPX Daily Chart - 28 March 2011

     In my last daily posting I stated that the bulls; if they want to show they are serious in rallying this market, need to show us a qualified break of the alpha-delta trend line (downsloping dashed red line). Last Friday the market closed above that line. Did yesterday's action qualify the break? Yes.
     In analysis terms, the implication of this is two fold. One, if the current 'y' pulse is not complete then we should now expect an assault on the next target level of 1332.28 (shown on the chart). Second, when/if the current 'y' pulse is complete, the next downward move ('z' pulse) should result in a low that is above the March 16 'x' pulse low.
     In practical terms, the daily chart remains in a bearish mode and hence there is no need for me to adjust my allocation mix which stands at a +50% reading. What would turn this chart bullish? At this time it would take a qualified break of 1345.5, and I don't expect that to happen within the near term.

Monday 28 March 2011

SPX Weekly Chart - 25 Mar 2011

     After registering a countdown 13 bar the cash SP500 fell for a month but bounced over the past week. This bounce has kept price in contact with the short (red) moving average.
     The question now is whether we go on to make a new high or if we resume the trip down to the next target: TDST support at about the 1220 level. Note that the medium (blue) moving average is at that level now.
     Bottom Line: The weekly chart is now in a bearish position. Will it stay that way? Why not let the market answer that question itself. It will take a confirmed break of the risk level of 1363.53 to return this chart to a bullish position.