Thursday 27 December 2007

Ending a triangle as we end a year?


The cash S&P500 moved higher to open the week but essentially ran in place yesterday on anemic volume. With volume expected to be light over the next few sessions due to the festive holiday season we may have to wait until the New Year to get moving again.
If the contracting triangle scenario is complete then we have the daily chart marked as shown. The triangle would be wave “4” within a larger five wave impulse structure.
My next series of posts will explore the larger Elliott structures in the S&P500. I will begin with a discussion of the new yearly chart on New Year’s Day.

Sunday 23 December 2007

Weekly Chart Elliott Possibilities -OR- The Triangle Lives?


After an uptrending week with a lower close the previous week, this week’s weekly chart of the cash S&P500 index formed a downtrending price bar with a lower close. The upward price pulse from the recent 1406.10 low completed 1523.57 high and a downward pulse is underway from that point.
Two weekends’ ago I asked “Is wave “c” over at 1406?” My answer then to that rhetorical question was “I think the weekly technicals are saying “yes”, but first we will have to see if resistance can be broken at the 1490 level.” Well we broke above that area on the daily chart but were stymied by resistance at around 1500 (red and blue moving averages on today’s chart) on the weekly chart.
As you know I have been of the opinion that we are forming a corrective pattern from the July high. Furthermore; even though I have been showing completed Expanded Flat patterns in my latest daily chart postings, I continue to believe that a very viable alternative count is a Contracting Triangle from the July high, with the move down from 1576 to 1406 as wave “c” of that correction. The move up to the recent 1523.57 high may have been wave “d” and this week’s decline wave “e”. The market may now be starting to thrust out of that triangle. But is wave “d” over? If it is not, then of course wave “e” is not. And then, the market rally that would seem to be a thrust of a completed triangle will end up being just the last part of “d”. These possibilities are labeled on today’s chart.
It is important to appreciate the fact that no matter what the correct count is, any of the presented possibilities (to include the daily posting scenario) is that the market will move to all time highs before ever breaking 1406.10. My main reason for thinking that perhaps the “d” wave is not complete is that it did not make a Fibonacci relationship with wave “b”. Those possible Fib points are the horizontal dashed blue lines on the chart. Of course, wave “d” isn’t required to make such a ratio it’s just that they often do.
My next post will be Thursday morning. Enjoy the holiday.

Friday 21 December 2007

Waiting on Santa


The cash S&P500 has essentially moved sideways over the past two days. Wednesday was uptrending and yesterday was an “inside” day. The price action has caused Tuesday’s low of 1435.65 to become both a price fractal and a CIT.
Of encouragement to the bulls is that the market is holding at these levels with the RSI indicator holding above the 40 level. This is what you would want to see if we are transitioning back to a bull market.

Wednesday 19 December 2007

Another Elliott Option


We have had two downtrending days since my last post. These postings will be a bit less frequent through the Holiday period.
Today I present another option for the Elliott Wave Count from the July high. It is also a bullish count for the near term (as actually the Contracting Triangle scenario was). In this count the market ended an a-b-c Expanded Flat pattern at the Thanksgiving (November 26) low. Wave “c” in this pattern was a five wave terminal impulse pattern. This option has been shown in this blog previously.
From the November low I now have wave 1’ and 2’ labeled, with wave 2’ being a large Expanded Flat. Some interesting relationships here:
1) wave 2’ ends at the 61.8% retracement area of wave 1’
Within wave 2’:
1) wave c” is 138.2% of wave b”
2) wave c” is 300% of wave a”
Additionally, note that both wave a” and c” are along the Gann Line shown by the down sloping red line. Let’s see what happens.

Monday 17 December 2007

Elliott Wave Musings


We had a clear downtrending day last Friday as the market appears to be breaking out; to the downside, of the 1470 -1490 congestion zone. The upward moving price pulse from the 12/12 low is over at the 12/13 high. The price high of 12/11 is now also a CIT (Change-in-trend) besides being a fractal.
Today I present an update on my Elliott Wave Count from the July high. It shows a developing Contracting Triangle pattern (a-b-c-d-e). The big issue now is whether the “d” wave was complete at the recent December 11 high. If it wasn’t then I may just have the wave degree off. That is, instead of the move from the November 26 low being an a’-b’-c’ zigzag it might be one less degree; an a”-b”-c” zigzag. This would mean that we are now in b’ instead of e; a big difference.
In any event, if wave “d” is in fact complete then we can draw the a-c and b-d trendlines as shown on the chart. Wave “e”, the last leg of the pattern, can not break below the a-c trendline which is at about 1415 now.
Time will tell!

Friday 14 December 2007

Quick Update + Gold


The market remains stuck in the 1470 -1490 congestion zone. Yesterday the cash S&P500 index formed an inside day as the downward moving price pulse from 1523.57 ended at 1468.23. The price high of 12/11 is now a fractal. After the large move down after the Fed decision on Tuesday and another downtrending day Wednesday the market has paused (less price movement) on lower volume. Market participants have lost interest in the decline for at least the moment as we wait to see which way we break from the 1470 to 1490 (moving averages and inverse head and shoulders) “decision zone”.
As there has not been much new information in the price action all I can do is repeat from yesterday “As there are no definitive “sell” signals in my technical indicators I have to continue to believe that we will break upwards out of this support zone. I will keep the stop on the SPY Long position at 146.30.”
For grins I present my Elliott Wave count on gold.

Thursday 13 December 2007

In the Congestion Zone


Although a volatile day, the downward moving price pulse from 1523.57 continues. The cash S&P500 index formed a downtrending day on Wednesday but it wasn’t your orderly type of downtrending day. After an explosive opening that saw the index move to over 1511 (about a Fibonacci 34 points up from yesterday’s close) the bears took charge and sold the market off towards the December 4th pivot low. We then closed up on the day. Volume continued to increase but the facilitation of price declined. This combination is what Bill Williams calls a “Squat” bar. On December 5th I wrote about this type of bar saying “The last time this happened we ended up with a price fractal high on 11/30. Now we should be watching for a low.” In fact, December 4th was the price fractal low. Are we seeing another low made now?
I think the best way to view this is to use the area between 1474 and 1490 (moving averages) as the “decision zone”. We are in that zone now, making a collective decision on whether to move higher or lower. A break upwards above the congestion zone is bullish and vice versa. This congestion zone also contains the neckline of an inverse head and shoulders pattern. As there are no definitive “sell” signals in my technical indicators I have to continue to believe that we will break upwards out of this support zone. I will keep the stop on the SPY Long position at 146.30.

Wednesday 12 December 2007

They Didn't Like the Fed Announcement I Guess

The Fed has spoken and the street has responded. As stated here yesterday the declining volume over the past few days was reason enough to expect a negative outcome from traders after the Fed decision. But what an outcome! A decisive break to the downside on much heavier volume. Price movement also increased and so we had a very bearish price/volume combination. The upward moving price pulse from last Tuesday’s price fractal low of 1460.66 ended at yesterday’s high of 1523.57.
The decline has brought us rapidly back into a broad area of support from 1470-1490. We are now testing both the neckline of the inverse head and shoulders pattern and the moving averages. As there are no definitive “sell” signals in my technical indicators I have to continue to believe that this market dip should be contained within the context of the developing uptrend from 11/26.

Of the price scenarios we had been following it is now clear that option (C) held sway. Now we have to see whether the market can hold the 1460 to 1471 area; which includes the previous fractal low, the red moving average and Gann 120 degrees down from yesterday’s high. I will keep the stop on the SPY Long position at 146.30.

Tuesday 11 December 2007

Fed Day! (Again)

Although volume continues to fall ahead of today’s Fed pronouncement, the buyers ruled and we had another uptrending day in the cash S&P500 market. If the volume/price movement relationship is telling us anything it is that there is reason to be concerned for the immediate uptrend following the Fed announcement. That all said, the fact remains that the upward moving price pulse from last Tuesday’s price fractal low of 1460.66 continues.

There are no other changes to speak of this morning. From a technical perspective the market continues to show strength and so the next market dip should be contained within the developing uptrend from 11/26. Of the two price scenarios discussed Friday we still can’t rule out either, but if option (C) is to occur then the market should be declining by tomorrow.

Monday 10 December 2007

Another new week, Another Fed Announcement

Although we had another uptrending day in the cash S&P500 market on Friday it was a much smaller range day. It was also a Reversal Day. A Reversal Day top is made when a new daily high is made but the close is below both the current open and previous close. Friday also had both lower volume and price movement as participants lost interest; most likely due to the impending weekend and upcoming Fed meeting. That all said, the upward moving price pulse from last Tuesday’s price fractal low of 1460.66 continues.
From a technical perspective the market continues to show strength despite Friday’s reversal day on weaker volume. The composite index has caught up to the RSI and so that potential negative is gone. We just may need to digest recent gains by “testing” the head & shoulders neck line we just broke through. That level is at 1486 today, which is smack dab in the middle of the short and intermediate moving averages. Remember also that 1490 is strong chart support.
Of the two price scenarios discussed Friday we can’t rule out either. They were:
A) If the price pulse low of 1460.66 marked a significant low then we should rally through this week into next without a pullback this week.
C) If 1488.94 was not significant then we are making a short term high now and we will pull back over the next few trading days.
I continue to favor scenario “C”. It also allows the market to hesitate and gyrate a bit into the Fed announcement this week. But there is not sufficient evidence to act upon. I will keep the stop on the SPY Long position at 146.30.

Sunday 9 December 2007

Weekend Report for December 9, 2007

The weekly chart of the cash S&P500 index formed an uptrending price bar this week. The upward price pulse from the recent 1406.10 low continues.

Last weekend I asked “Is wave “c” over at 1406?” My answer to that rhetorical question was “I think the weekly technicals are saying “yes”, but first we will have to see if resistance can be broken at the 1490 level.” Well we broke above that area on the daily chart and we are now battling resistance at around 1500 (red and blue moving averages on today’s chart) on the weekly chart. Even though we have popped above those moving averages I can’t say we have cleared through them. Anyways, back to our Elliott discussion.

As you know I have been of the opinion that we are forming a corrective pattern from the July high. Furthermore; I continue to believe that the pattern best fitting the weekly chart is a Contracting Triangle from the July high, with the move down from 1576 to 1406 as wave “c” of that correction. That would mean that we are now in wave “d” with an “e” wave decline to come. Important though is the fact that in such a pattern the “e” wave will end above the “c” wave low. This means that the correction low is in.

Tracking the “d” wave in real time will be a challenge for me. I do know that it will end below the “b” wave peak. But where? And when? A possible guideline to use is from Connie Brown’s book “Technical Analysis for the Trading Professional”. On page 222 she writes “Wave D …. Frequently forms a Fibonacci relationship relative to wave B.” We are at the 50% level now, where we are battling resistance with the moving averages as explained above.

Friday 7 December 2007

One Scenario Deleted


Another strong uptrending day was formed in the cash S&P500 market on Thursday. The upward moving price pulse from Tuesday’s low (which is now a price fractal low) of 1460.66 continues. Volume was lower and price movement higher on Thursday which is not a particularly bullish combination. It is often a sign that the rally is “false” unless volume comes back into the market.
From a technical perspective the market continues to show strength. The rally sliced cleanly through both the neckline of the inverse head and shoulders pattern and chart resistance (long term (green) moving average as well as strong chart resistance at the 1490 level).
One explanation of why the volume/movement combination may be a bit weak here is that many times we must come back and “test” the head & shoulders neck line we just broke through. Another potential negative I will be watching here is how the composite index is lagging the RSI on the daily chart. For now though I am long the SPY (from 149.92) in the Investopedia account I opened on August 9 to accompany these blog studies.
Of the three price scenarios laid out yesterday, we can now rule out “B”. We are left with:
A) If the price pulse low of 1460.66 marked a significant low then we should rally until into the week after next.
C) If 1488.94 was not significant then we will make a high over the next few trading days and then pullback for a few days.
The “potential” weakness discussed above leads me to slightly favor “C”. But there is not sufficient evidence to act upon. I will keep my stop on the SPY position at 146.30.

Thursday 6 December 2007

Scenarios

The cash S&P500 market reversed gears and closed higher on Wednesday forming an uptrending day. The downward moving price pulse from Friday’s high of 1488.94 was complete at 1460.66. Both volume and price movement increased Wednesday which is bullish.

Needless to say nothing was resolved yesterday. The rally went right up to the neckline of a proposed inverse head and shoulders pattern discussed yesterday. Note that this is also just below the long term (green) moving average as well as strong chart resistance at the 1490 level (see yesterday’s chart). The challenge for the bulls is to cleanly break through that resistance. Supporting the cause is the fact that the negative reversal on the daily RSI has been negated and so the current technicals are bullish.

Here is a unique take on the daily chart based on some experimental timing work I am engaged in. There are a few scenarios.

A) If the price pulse low of 1460.66 marked a significant low then we should rally until into the week after next. If 1460.66 was not a significant low then the question revolves around whether 1488.94 was a significant high.

B) If 1488.94 was significant then the market will fail to break above 1489 here and fall for about a week.

C) If 1488.94 was not significant then we will make a high over the next few trading days and then pullback for a few days.

My pending long trade of SPY will be o.k. if scenario A unfolds. I should not get filled under Scenario B. What concerns me is Scenario C. In that case I will get filled right before the market begins a correction.

Note to self: Of course Scenario C will unfold.

Wednesday 5 December 2007

Buy Parameters Identified

The cash S&P500 market put in another downtrending day on Tuesday as the downward moving price pulse from Friday’s high of 1488.94 (which is now a fractal high) continues to unfold. My data shows that volume increased slightly on Tuesday’s bar and that price movement continued to decrease, again forming what Bill Williams calls a “Squat” bar. The last time this happened we ended up with a price fractal high on 11/30. Now we should be watching for a low.

The current decline from last Friday’s high can be seen as potentially forming the right shoulder in an inverse head and shoulders pattern. Note that the neckline (shown in orange on today’s chart) lines up with the long term (green) moving average as well as strong chart resistance at the 1490 level.

Breaking above (through) the 1490 area would be a sign of strength and would also negate the only technical negative I have, the negative reversal on the RSI discussed yesterday.

And so my course of action is set. I will go long the SPY on any move above 149.87. If filled my initial stop will be placed at either yesterday’s low or today’s low; whichever is lower.

Tuesday 4 December 2007

Time to Retest the 11/26 low?


The cash S&P500 market formed a downtrending price bar on the daily chart Monday. The price pulse upward from 1406.10 completed at Friday’s high of 1488.94. Both volume and price movement decreased as traders lost interest in the recent bull move up from the 11/26 low.
Besides being turned back by resistance; right at the intermediate and long moving averages which coincided with the strong chart resistance at the 1490 level, the RSI has turned down to form a negative reversal with the price made on 11/6. The projected minimum price target is 1400.05.
This price action (with a price projection below that of the 11/26 low 1406.10) leaves the door open as to whether the move down from the 10/11 high is complete or not. At this point I believe it is, but even if it is not any new low should represent a good buying opportunity in SPY since that would be the Elliott wave five low. This count (not my preferred) is shown in today’s chart.
From here any move below 1458.36 (without first breaking 1488.94) would cement the idea that the Elliott wave up from 11/26 is complete. The downward move should complete by 12/20. I still plan to use this decline as a place to get long the SPY.

Monday 3 December 2007

New Month Begins


The sharp rally off of the 11/26 low continued on Friday with another uptrending price bar forming on the daily cash S&P500 chart. The price pulse upward from 1406.10 continues. Although volume increased on Friday’s bar the price movement continued to decrease, forming what Bill Williams calls a “Squat” bar. He says (in the book Trading Chaos) “Virtually all moves end with a squat as the high/low bar plus or minus one bar of the same time period.” This would mean that a short-term high is being made here.
That shouldn’t come as a surprise when one looks at where we found resistance on Friday – right at the intermediate and long moving averages. These coincide with the strong chart resistance at the 1490 level. With the higher level time frame charts pointing to at least a retest (if not outright new highs) of the old high, the big move up from 11/26 may just be the first move in a new upwards moving Elliott pattern. If so a correction may now be due on the daily charts.
Elliott-wise I believe the odds favor the view that the low is in (11/26) but I can’t be 100% certain. And so I will go with the odds; looking for a place to get long the SPY on short-term weakness.

Sunday 2 December 2007

Weekend Update for December 2, 2007


The weekly chart of the cash S&P500 index formed an “outside” price bar with a higher close this week. The downward price pulse from the recent 1552.76 high is confirmed complete at the 1406.10 low.
Technically it was an important week as the RSI formed a positive reversal and; when viewed with the Composite Index, flashed an outright “buy” signal. These events occurred after a price low at the long (green) moving average which was just above our target box of 1390-1402. The RSI reversal indicates a minimum target of 1569.44. This is about 10 points below the monthly reversal target discussed yesterday, but note that they are “minimum” targets. At the very least they point to a retest of the all-time high.
Although I always have more than one possible Elliott Wave count they all share the common theme that we are forming a corrective pattern from the July high. Furthermore, I continue to believe that the move down from 1576 to 1406 was wave “c” of that correction. My other thoughts continue to be that:
1) We will hold the August low during the current correction.
2) That the correction will terminate by the end of the calendar year.
The key Elliott question is whether wave “c” is over, not whether it ended the correction. Personally, my preferred count is that the pattern best fitting the weekly chart is a Contracting Triangle from the July high. But it doesn’t matter at this point. Is wave “c” over at 1406? I think the weekly technicals are saying “yes”, but first we will have to see if resistance can be broken at the 1490 level.

Saturday 1 December 2007

Monthly Report November 2007


November ended up being a downtrending price bar on the cash S&P500 monthly chart. The price pulse up from the fractal low and Change-In-Trend (CIT) at August’s low of 1370.6 is confirmed complete at October’s high of 1576.09. This number is still short of the minimum target of 1579.07 produced by the positive reversal in the RSI at the end of August when the market stood at 1473.99. As of the end of November this reversal target is still in play.
Today’s chart shows that the monthly price bars continue to bounce along the short (red) moving average; the fierce rally of the last few days preventing us from ending the month below that short moving average. In fact, we haven’t closed below that average since the bull run got underway in earnest after the 2002 low.
At the end of June 2007 (1503.35), the monthly chart gave a technical “sell” signal when the composite index failed to confirm the new May high in the RSI and both indicators turned down. We have now reinforced that sell signal since the new all-time closing high in October was not accompanied by a new RSI high and both price and the RSI have turned down in November. Last month I wrote that “Although danger may be building in this time frame, the market must be considered bullish on the monthly chart until it gives a clear signal otherwise.”
Until the positive reversal is negated or the August low violated I think the bull is clinging to life on the monthly chart with at least one more new all-time high required.

Friday 30 November 2007

Another Elliott View


Although much more subdued, the cash S&P500 index formed another uptrending price bar on the daily chart Thursday. The price pulse upward from the low on 11/26 at 1406.10 continues. Both volume and price movement decreased on yesterday’s move, a possible sign that interest in the immediate move is fading.
Not much to add today. As you know I am always looking at possible wave counts in real-time. As we have been speculating on whether the action from the July high is an a-b-c-d-e contracting triangle or an a-b-c expanded flat, today I present a count that has the entire move down from the 10/11 high as an “Ending Diagonal” (also known as a “Terminal Impulse” or “Ending Diagonal Triangle”) pattern. This would mean that the move from the July high to the August low was “a”, the move up to the October high “b” and the Ending Diagonal shown today the “c” wave in a large expanded flat. Just food for thought.
I will try to update the new monthly and weekly charts over the weekend.

Thursday 29 November 2007

Is it an Ending Diagonal? Positively Maybe.

The cash S&P500 index surged forward yesterday on an uptrending price bar. The low on 11/26 at 1406.10 is now marked as a CIT (Change-In-Trend) by the green ellipse and as a price fractal low (blue diamond). Both volume and price movement increased on yesterday’s move, a bullish sign. Recall that we just had bullish divergence between price and the RSI.

Yesterday I presented a speculative wave count that showed a corrective a’-b’-c’ pattern developing from the October 11th high at 1576.09. In any such “a-b-c” correction the “c” wave must be a five. As depicted the five waves down from the 10/31 high may have unfolded as an “Ending Diagonal” (also known as a “Terminal Impulse” or “Ending Diagonal Triangle”) pattern. Most times the market will react violently after the completion of such a pattern. As Frost and Prechter state in the classic “Elliott Wave Principle”, “… diagonal triangles all imply the same thing: dramatic reversal ahead.” (pg. 40). If this count has merit the low should be in and the 1490 resistance area will be broken.

And so I think the wave count has merit but is it the correct count? I don’t know. The a’-b’-c’ could still be a 1’-2’-3’ and we could be in 4’ now. If so we will not break 1490 and then we will see another new low in 5’. I guess time will tell.

Sadly the astute reader will have noted that gave up on trading the RSI signals right before this big move higher. Following previous moves I would be long the SPY now. Instead I skipped the trade because the weekly chart was negative. Only time will tell if I have “missed the boat.” But that is what the journal is for – to document lessons learned so that they stare me in the face and I can’t run and hide from them.

Wednesday 28 November 2007

Struggling With the Count

The cash S&P500 index formed an “inside” price bar on Tuesday. Once again we had another technical “buy” signal on the daily chart as Monday’s new price low was not accompanied by a new low on the RSI.

Yesterday I presented a weekly chart which showed three price pulses down from the October high of what I believe to be a “C” wave from the July high. Today I show a potential Elliott Wave count on the daily chart that would match the weekly.

This speculative count shows the “C” wave from October as being a corrective a’-b’-c’ pattern itself. In any such “a-b-c” correction the “c” wave must be a five. As depicted the five waves down from the 10/31 high are unfolding as an “Ending Diagonal” (also known as a “Terminal Impulse”) pattern. If this count has merit we should not break above Monday’s high before we fall to a new low.


Tuesday 27 November 2007

SPY Rejects My Friendly Overture


An “outside” price bar with a lower close formed on the cash S&P500. After a positive opening (which got me long in SPY) we reversed and ended badly (which got me stopped out for another loss in SPY). The development of my swing trading strategy is not progressing all that well!
In retrospect, yesterday’s statements that “A negative is that the market can’t afford to hesitate (turn down on a daily closing basis) here or negative reversals would form in the RSI”, and “Another huge concern is that the positive reversals on the weekly chart have been negated and that time frame remains on a technical “sell” signal” were the relevant analysis tidbits amongst the noise. At issue is how could I have done better by clinging on to that information rather than the bullish indicators that I did glom onto?
One way would be to let the higher time frame hold sway over the shorter. That is, since the weekly chart is on a “sell” I should only take daily short trades. Under that scenario I would not have gone long the SPY. As of this morning that would also mean I can’ consider a long position. Not that I would want to anyway as all the technicals are now weak.
Today I present the “in progress” weekly chart. Of note is the long (green) moving average which lies just below the market. Will we find support here? We did in August. Yesterday I got a comment to my post predicting that wave 3 (of C) would end at 1399. I must admit that we are in the third price pulse down (the blue lines) of what I believe to be “C”. I also have a Gann target (horizontal green line) at 1399 which is in the target box I have been eying for a while.
I will watch to see what happens whilst I lick my wounds.

Monday 26 November 2007

On Your DeMarker .... Get Set ...


A strong uptrending price bar was the result of holiday-shortened trading in the cash S&P500 last Friday. The one day downward price pulse from the 11/20 high ended at the 11/21 low and we have a new upward price pulse developing from that point. Friday was also day 2 of a Snap-Back Reversal Day pattern. Although many are always suspicious of making much of the post-Thanksgiving Friday action (due to the usual dramatic drop in volume) I must still tackle the problem stated over the weekend of “whether or not we have just have ended the “c” wave of [the] correction.”
The first item of note is that since we turned upwards on Friday we have confirmed bullish divergence between price and the RSI indicator in the target zone identified on the weekend post of November 10-11 (1413-1417). The possibility that we might have just completed a Terminal Impulse pattern also remains. This “terminal” pattern, also known as an “Ending Diagonal”, would (if that were truly the correct count) be a larger "c" wave and complete the correction that began at the July high.
A negative is that the market can’t afford to hesitate (turn down on a daily closing basis) here or negative reversals would form in the RSI. Another huge concern is that the positive reversals on the weekly chart have been negated and that time frame remains on a technical “sell” signal.
I guess what swings the argument to “bullish” for me is that the DeMarker Indicator (shown on today’s chart) says we should be looking for a bottom here. Look for bottoms when the indicator goes below 0.3. Doesn’t mean we will get one but that the odds favor bullishness. Bottom Line: I will go long the SPY on any move above 144.35. Initial stop will be at 141.66.

Saturday 24 November 2007

Weekly Report for November 24, 2007


The weekly chart of the cash S&P500 index formed its third consecutive downtrending price bar this week. The downward price pulse from the recent 1552.76 high continues.
Last weekend I noted that the RSI had produced two “positive reversal” signals. Easy come, easy go. These were negated by the price action turning lower and causing the RSI to break below the trendline established by the reversal points (see today’s chart).
Technically, this brings us back to what I wrote two weekends ago:
“On October 19th the weekly chart produced a technical “sell” signal when the RSI failed to confirm the price high. At this time we still don’t have a “buy” signal. My current Elliott count is that we are forming a corrective pattern from the July high. Furthermore, I believe that we are in wave “c” of that correction now. What else do I believe about the S&P500?
1) We will hold the August low during the current correction.
2) That the correction will terminate by the end of the calendar year.”
I still hold to those thoughts and that the Elliott pattern best fitting the weekly chart is a Contracting Triangle from the July high. The question to face on the daily chart is whether or not we have just have ended the “c” wave of that correction. Note that we have bounced from within the first of my two target zones that I have displayed over the past few weeks.

Thursday 22 November 2007

Thanksgiving Day - Markets closed or "Let them eat Turkey"


Another downtrending price bar was formed on the cash S&P500 daily chart as the one day upward price pulse from the 11/20 low ended at Tuesday’s high and we have a new downward price pulse developing from that point.
Since we made a new low on Wednesday I canceled my buy stop order on the SPY. My analysis still contains many elements that point to a market poised to reverse but those may slip away without a strong showing by the bulls on Friday. The latest chart still shows possible bullish divergence between price and Wilder’s RSI. The main difference between now and Wednesday morning is that, unless we turn upwards, it is only “possible” divergence. Price continues to be in the target zone identified on the weekend post of November 10-11. On November 8th I wrote “My next Fibonacci clusters are at 1461-1463 and then 1413-1417. … From the recent high I have Gann Wheel targets at 1469.5, 1459.5, 1437, and 1421.” Yesterday’s low was at 1415.64. You can see these targets on today’s chart. The possibility that we might be in the latter stages of a Terminal Impulse pattern also remains.
There are growing negatives. A huge concern is this week’s developments on the weekly chart. Granted we still have Friday’s abbreviated action to turn things around, but right now the weekly is at a new low (closing basis) from the July peak along with the technical indicators. I’ll examine the weekly chart (over the weekend) before deciding on whether to take any trading positions.

Wednesday 21 November 2007

Futures are Down over 16 points? I will put in a Buy Stop.


Even though we had a downtrending price bar yesterday it was a Key Reversal Day (KRD). It certainly was a volatile day! A Key Reversal Day in a downtrend is one where the market opens above the prior day’s close, makes a new low, but closes above the prior day’s close and the current day’s open. The downward price pulse from the 11/16 high ended at yesterday’s low and we have a new upward price pulse developing from that point.
Adding to the bullishness of the KRD were more technical “buy” signals! Today’s chart shows the bullish divergence between price and Wilder’s RSI. This signal was registered at the close after we made low in the upper part of the target zone identified on the weekend post of November 10-11. On November 8th I wrote “My next Fibonacci clusters are at 1461-1463 and then 1413-1417. ... From the recent high I have Gann Wheel targets at 1469.5, 1459.5, 1437, and 1421.” Yesterday’s low was at 1419.28. You can see these targets on today’s chart.
So, we had a KRD with technical buy signals in an area of the chart previously identified as support (Fibonacci and Gann cluster). Finally, as presented yesterday, we might also be in the latter stages of a Terminal Impulse pattern.
Based on this technical evidence I will be placing a buy stop order on the SPY at yesterday’s high. However, I will cancel this order if we make a new low first; and this is certainly possible as I note the GLOBEX futures are down over 16 points as I type this!

Tuesday 20 November 2007

This Blog Documents My Ideas ..... and MISTAKES


We had a downtrending price bar form yesterday on the cash S&P500 daily chart. It also made the high of 11/14 a price pulse Change-In-trend. The upward price pulse from the 11/15 low ended at last Friday’s high and we have a new downward price pulse developing from that point.
As I stated yesterday,”The way we break out of the small range day made on Friday will tell us volumes about the near-term direction of the market”. We broke out to the downside and this has caused me to review my work.
The main purpose of this blog is to force myself into a much more rigorous and methodical approach to my analysis. It is obviously needed as I made such an obvious mistake I could kick myself. Luckily I never was filled on the long-side and so the mistake was not one I had to pay for in real dollars. But it is embarrassing just the same. More so since it is being acknowledged in this public forum.
On Wednesday morning the 14th of November I wrote, “…finally got a technical “buy” signal! Both the Composite Index and Derivative Oscillator (shown on today’s chart under the RSI) turned up after making higher lows than the RSI (top indicator).” This is fine and good but then I ignored the indicator. FATAL ERROR. Today’s chart shows the Composite Indicator on top of the price chart. Notice that the indicator just made a higher high than it did on November 6 (these points are noted with the blue arrows). The higher high came with a lower price. This is a Negative Reversal and warns that the earlier buy signal was early. This negative reversal signal was in-place as of last Thursday.
Since these signals often come in fourth waves I have posted a very intriguing wave count. Could we be in the latter stages of a Terminal Impulse pattern? If so we are ending the “c” wave of the pattern that started at the July high.
Let’s see what happens. Any rally from here will result in new technical “buy” signals. The swing trading system I am trying to develop (another reason I use this blog to document my thoughts) will not let me do anything until such a signal is generated.

Monday 19 November 2007

Was it a Successful Retest?


Trading action caused an inside day to form in the cash S&P500 on Friday. It also made the high of 11/14 a price fractal high and last Monday’s low a price pulse Change-In-trend and these developments are marked on today’s chart. The downward price pulse from the high of 1492.14 ended at 1443.49 last Thursday and, for now, constitutes a successful retest of the low set last Monday at 1438.53. Volume picked up on Friday, meaning that the move lower (the downward price pulse just completed) stopped on higher volume. Often times this type of price action comes at key reversal points (but not always). The way we break out of the small range day made on Friday will tell us volumes about the near-term direction of the market.
Since I continue to be in the camp that believes we are in the process of a successfully retesting the low, I will be going long the SPY (I still haven’t been filled) on any move above Friday’s high unless we get a new low first. My initial stop will be right beneath Monday’s low.

Saturday 17 November 2007

Weekend Report for November 17-18, 2007


The weekly chart of the cash S&P500 index formed a downtrending price bar this week. Based on volume (lower) and price facilitation (lower) it was a week that indicated a fading of interest in the short side. This is interesting since the previous two weeks showed an increase in both volume and price facilitation; which indicated increased bearishness. Has sentiment changed? The candlesticks are supporting that notion as we had a “gravestone” form this week. This pattern is indicative of a possible bottom but it is prudent to wait and see how the price action behaves early in the next candlestick. The downward price pulse from the recent 1552.76 high continues.
Of note technically this week is the fact that the RSI turned up, which has produced two “positive reversal” signals. Price targets (minimum) are 1569.56 and 1561.95.
The Elliott pattern that best fits this technical evidence is a Contracting Triangle corrective pattern from the July high. We may just have ended the “c” wave of that correction. My roadmap for the final two waves of the triangle can be seen in this weekend’s chart. If wave “c” is not over I have left my two lower target zones on the displayed chart.
Bottom Line: The weekly chart does not conflict with the daily chart’s suggestion of a bottom being made. I feel comfortable looking for a long position in the SPY at this point.

Friday 16 November 2007

Still Looking to Buy


We had a downtrending day in the cash s&P500 on Thursday. The downward price pulse from the high of 1492.14 continues as we retest the low set Monday at 1438.53. Volume continued to shrink yesterday but is now giving a different message than it has for the past few days. We now have the same price/volume relationship we had on Tuesday. Price is moving easily but the volume has decreased. Wednesday morning I wrote that “It is a warning sign that the prior trend will resume unless volume comes into the market”. This is what happened as we reversed to the downside Wednesday. Now, if volume doesn’t come in to the market we may reverse to the upside.
Since I continue to believe the retest will be successful and that the low is in, I will be going long the SPY on any move above yesterday’s high unless we get a new low first. I think we have an excellent risk/reward situation here. My initial stop will be right beneath Monday’s low.
If we do get a new low it will most likely be associated with the wave count presented in today’s chart. It shows that one more push lower is due in a fifth wave. Note that in this count waves iv” and i” do not overlap and that waves ii” (expanded flat) and iv” (zigzag) alternate.

Thursday 15 November 2007

Positioning to go Long

One need not look for a Reversal Day price bar any longer. We had one yesterday. Although an uptrending bar, price made a new high but closed below the prior day’s close and the current day’s open. The upward price pulse from the low of 1438.53 (which is now classified as a price fractal low) completed at yesterday’s high. Volume continued to shrink which continues to be bearish at this point.

Although we poked above it, the 1490 level proved to be good resistance yesterday. Previously that level had been support and so; particularly after yesterday's reversal bar, a retest of the most recent low appears to be in the cards.

Since I believe the retest will be successful and that the low is in, I will be going long the SPY on any move above yesterday’s high. Actually I don’t expect to be filled today, but I am willing to position my long based on the belief that we are due a short-term low by this coming Monday. My entry point will follow the price bars down as long as we don’t get a new low. My initial stop will be right beneath Monday’s low. For my blog related trading account at Investopedia (the No End competition) under the name of SaxbyFox, I will be putting in a buy stop for SPY shares at a price of 149.41. My initial stop (when filled) will be just under Monday’s low of 143.69 so that I am risking 5.72 points.

Wednesday 14 November 2007

Buy Signal!


It was an exciting day to be a bull yesterday as the daily cash S&P500 formed an uptrending price bar. The downward price pulse from 1520.77 is over at Monday’s low and a new upward pulse is underway from that point. However, there were some small items of concern. We did not have a clear reversal bar (Reversal Day; Signal Day; or Snap-Back Day) and it was what Bill Williams calls a “Fake” bar. This describes a situation where even though price is moving easily the volume has actually decreased. It is a warning sign that the prior trend will resume unless volume comes into the market.
On the other hand (we always have two hands don’t we?) I finally got a technical “buy” signal! Both the Composite Index and Derivative Oscillator (shown on today’s chart under the RSI) turned up after making higher lows than the RSI (top indicator). This would seem to confirm the Elliott wave count presented yesterday that Monday’s low marked wave v” of c’, which implies that the entire decline from October 11th is over. Note that I have been saying v” of c’ instead of v” of 3’. The wave count v” of c’ implies that we will see new highs before we ever break Monday’s low. If Monday’s low were v” of 3’ we would break to a new low before we even broke above 1490.40.
Therefore, the first test of the current wave count will be previous support; which is now resistance, at that 1490 level. If our count is correct we should break this level without going to a new low.
Since I believe the hand that says the low is in, my problem is the mechanical one of where to enter a long position. For me, I am most comfortable waiting for the first pullback. This is defined by my timing work and should occur before the end of next week. More on that whole mess later.

Tuesday 13 November 2007

Speculation Concerning a Low


Another day, another downtrending price bar on the daily cash S&P500 chart. The downward price pulse from 1520.77 continues.
Boring? Hardly. We have now reached the 1432-1438 support level laid out in my post of November 9th. Yesterday’s low was actually at 1438.53 (a half point is close enough for me). When one considers that the brief consolidation that started with the strong rally from the low on November 8 may mark Elliott wave iv’ of c’, then yesterday’s low may be v” of c’. That would imply that the entire decline from October 11th may be over. This wave count is labeled on today’s chart.
Even if we are at bottom I will not be going long; as I don’t have a technical “buy” signal yet. If the wave count presented today is correct I should have such a signal soon.

Monday 12 November 2007

RSI Developments to Take Note Of


The daily cash S&P500 chart formed another downtrending bar on Friday and so the downward price pulse from 1520.77 continues.
Perhaps one of the most significant technical signals on the daily chart of late was Friday’s move in the RSI (Welles Wilder’s Relative Strength Index) below the level of support in bull markets. This came after the index failed to move above the level of resistance typically found in bear markets (see chart). It is this action that leads me to my Elliott wave count is that we are in a “c” wave which is part of either an Expanded Flat or Triangle that began at the July high. If “c” is part of a Triangle it will itself be an “a-b-c” pattern. If part of a Flat it will be a “1-2-3-4-5”. In both of these options the “c” or “3” waves will themselves be five waves. Therefore, we may have just completed, or are very close to completing, iii” of c’ or iii” of 3’.
Bottom Line: My thinking is that we will see wave iv” and v” of c’ (or 3') play out this week; perhaps very quickly. As that happens I will be watching for a technical “buy” signal and then decide whether to come off the sidelines.

Sunday 11 November 2007

Weekly Chart Review for November 11, 2007


The weekly chart of the cash S&P500 index formed a downtrending price bar this week. As shown in the chart we were not able to hold support at the confluence of the short (red) and medium (blue) moving averages. The downward price pulse from the recent 1552.76 high continues.
On October 19th the weekly chart produced a technical “sell” signal when the RSI failed to confirm the price high. At this time we still don’t have a “buy” signal. My current Elliott count is that we are forming a corrective pattern from the July high. Furthermore, I believe that we are in wave “c” of that correction now.
What else do I believe about the S&P500?
1) We will hold the August low during the current correction.
2) That the correction will terminate by the end of the calendar year.
I have added two likely target zones to the chart for the end of the correction. The higher aligns with the 1413-1417 zone previously discussed.
Bottom Line. All of the above work helps to “frame” the price action but here is the true bottom line: With the weekly and daily charts on a “sell” signal I will remain on the equity sidelines.

Friday 9 November 2007

Bull and Bears in the Endless Dance


Yet another downtrending price bar on the daily cash S&P500 chart. The downward price pulse from 1520.77 continues and that high price on 11/06 is now a fractal high.
The last technical signal on the daily chart was on October 10th when the Composite Index failed to confirm the RSI’s new high. That coincided with the 10/11 “b” wave peak in the weekly chart. As of this morning we are still waiting for a daily chart “buy” signal.
From an Elliott perspective my best attempt at a wave count is that we are in a “c” wave which is part of either an Expanded Flat or Triangle that began at the July high. If “c” is part of a Triangle it will itself be an “a-b-c” pattern. If part of a Flat it will be a “1-2-3-4-5”. In both of these options the “c” or “3” waves will themselves be five waves. Therefore, we may have just completed iii” of c’ or iii” of 3’ yesterday.
How low can the larger “c” go? Yesterday I laid out support levels from a weekly chart perspective. Today’s chart shows shorter-term support levels – and we reversed at one yesterday with a strong rally late in the day. The only thing I don’t like about this Fib cluster is that it is not accompanied by a Gann target.The next area of support does have a Gann target. That is the 1432-1438 area. Underneath that is the 1413-1417 zone mentioned yesterday. Notice all the hits there on today’s chart.
Bottom Line: I’m still on the sidelines. The market did not react at the 1468-1469.5 or 1459.5-1463 areas and I still don’t have a technical buy signal. Now I will watch to see whether previous support around 1490 has become resistance.

Thursday 8 November 2007

Back to the Drawing Board


The question has been answered. Not only did we not hold the October 24th low, but we also took out the supposed wave “1” top of 1479.40. Needless to say it was a very bearish day as we formed a downtrending price bar on the daily chart. The upward price pulse from 1489.95 ended at 1520.77 and we are now doing a new downward pulse.
Whenever I step off track (which happens too often I am afraid!) I like to step back and simplify. Going back to the weekly chart (shown in this post), I have been tracking the bearish divergence of the momentum indicators with price in my weekend posts. A “sell” signal was generated July 20 when the RSI failed to confirm the new high in price. I have been calling that top a wave “3” peak. We then formed three distinct price pulses to the downside. Next, the weekly chart formed an RSI “positive reversal” on August 10. In my post of October 6 I wrote “Last week I wrote about the positive reversal signal generated in the weekly RSI on August 10 that pointed to a calculated minimum target of 1548.54. This target has now been realized.” On October 19th the weekly chart produced yet another technical “sell” signal when the RSI again failed to confirm the price high. From the August low until that signal we had THREE clear price pulses to the upside.
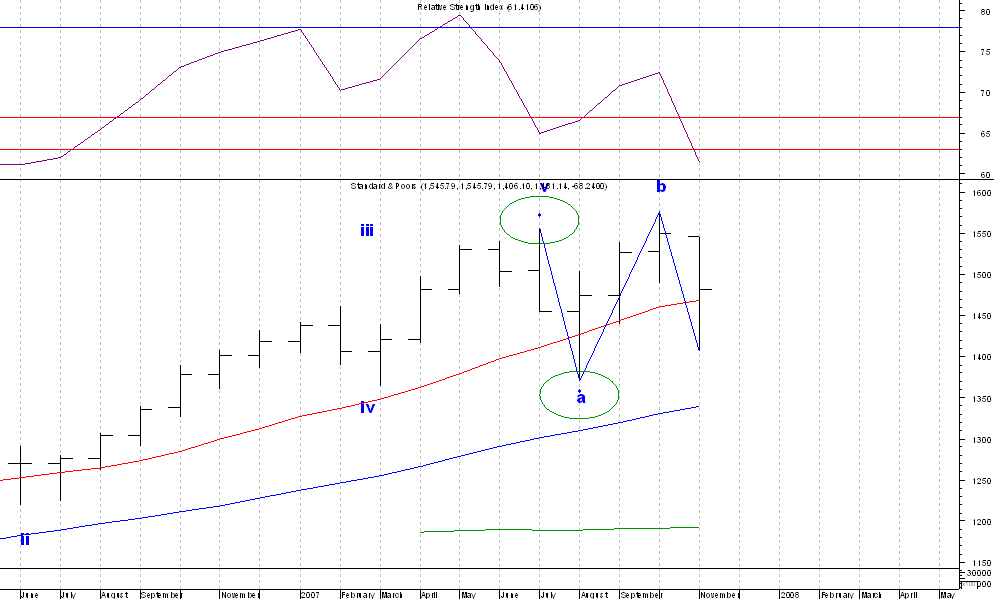
To recap: we had a “sell” on July 20 followed by three waves down. A positive reversal on August 10 followed by three waves up. Another sell signal came on October 19. In my weekend posting for October 20-21 I wrote “We now have three distinct price pulses up from the August low. At one time I was viewing this action as an “A-B-C” Zigzag pattern. I have recently changed that view to a “1-2-3” of an Impulse pattern.” I now believe that was my big mistake.
At this point it appears that we are still in the corrective pattern that began at the July high. As labeled on the chart above the move down into the August low was wave “a” and the recent peak wave “b”. We are now in wave “c” of that correction; which is either an Expanded Flat or Triangle. Of course there could be other counts, but I will keep it simple for now.
The last technical signal on the daily chart was on October 10th when the Composite Index failed to confirm the RSI’s new high. This coincided with the “b” wave peak in the weekly chart. As stated in this blog more than once, we have not had a new technical “buy” signal since that point. As of this morning we still don’t have one.
How far will wave “c” go? The first support I note is from the short term moving average on the monthly chart. That is at 1468. My next Fibonacci clusters are at 1461-1463 and then 1413-1417. The weekly long term moving average is heading towards the lower area now (currently at 1400). From the recent high I have Gann Wheel targets at 1469.5, 1459.5, 1437, and 1421.
Bottom Line: I’m still on the sidelines. Let’s see how the market reacts at the 1468-1469.5 or 1459.5-1463 areas.

Wednesday 7 November 2007

Dollar Woes Abound as SPX Continues to Hold Ground


The market continues to hold the 1489 area (the 10/24 low) and formed an uptrending bar yesterday. This ended the downward moving price pulse that began at the 10/31 high and began a new upward moving pulse from Monday’s low. I may sound like a broken record but I am still waiting to resolve the question: Can we hold the October 24 low?
A positive since October 19th is that the RSI has held the area associated with bull markets. A negative yesterday is that we rallied on lighter volume. A neutral is that we moved right up against the short term (red) moving average, which is also just about where the weekly Drummond geometry PLDot sits as well as the 50% retracement of the last price pulse. Thus, we might be up against at least short-term resistance and might have to test the low once again.
With the cash S&P500 being range bound since mid-October I have slightly revised the wave count on today’s chart. The bigger picture remains the same in that we still need one more move to new highs to complete the five wave pattern that may have begun at the August lows. The main change is that I now have the fourth wave (iv’) of the pattern ending at Monday’s low as a Flat from the October 11 high. However; if four is not complete we may see continued choppy action over the coming days as the pattern continues to evolve.
One reason I changed the count is to better reflect the symmetry and balance in the impulsive price action from 8/28 to 10/11. Working within this area provides a nice Fibonacci cluster at the high (see chart).
Bottom Line: I’m still waiting to see if we can make a bottom. As stated once before, the “ideal” way to end this consolidation would be to close below 1500 (without breaking 1489) while the RSI stays above 40.17 setting up bullish divergence. Is it possible to have an “ideal” outcome? We’ll see!! Meanwhile I remain on the sidelines.

Tuesday 6 November 2007

Quick Update in Waiting Mode

Yet another downtrending bar has formed on the cash S&P500 index as we fell to within a whisker (0.39) of the October 24 low. The downward moving price pulse that began at the 10/31 high continues.

We are still waiting to resolve one key question: Can we hold the October 24 low? The market again managed to stay above that 10/24 low of 1489.56 but seems to be hanging by a thread on the long term (green) moving average.

Bottom Line: I’m still waiting to see if we can make a bottom. I also want to see whether 1489 can hold and; more importantly, 1479. I remain on the sidelines.

Monday 5 November 2007

Hammering Out a Bottom??


We saw another large downtrending bar develop in the cash S&P500 on Friday. However, unlike Thursday, we closed higher on the day. This price action has now caused the 10/31 price bar to contain a fractal high. Even with a higher close on Friday, I must also note that the downward moving price pulse that began at the 10/31 high still continues. This forces us to face the key question: Can we hold the October 24 low?
The market managed to stay above our “do or die” 10/24 low of 1489.56 but was it a reversal bar? No. At least it wasn’t a Reversal Day; Signal Day, or Snap-Back Reversal Day. How about from a candlestick perspective?
The following is from the stockcharts.com candlestick dictionary: "Hammer candlesticks form when a security moves significantly lower after the open, but rallies to close well above the intraday low. The resulting candlestick looks like a square lollipop with a long stick. If this candlestick forms during an advance, then it is called a Hanging Man."
So we have a Hammer. Yosuke Shimizu; in his article “Reading Candlestick Charts” in the book “Breakthroughs in Technical Analysis; New Thinking from the World’s Top Minds” (edited by David Keller), calls this pattern a Takuri shape and states “… they represent an opportune buying signal, especially if they are accompanied by high volume”. Note that Friday’s volume is in the top five since the August bottom.
So what now? I’ll be waiting to see if we can make a bottom. I may trust the Hammer pattern but I want to verify it. Particularly since the GLOBEX has the s&p down 15 points as I type this!
Bottom line: As far as the wave count goes I will quote my last blog entry:”1489 must hold or I am back to the drawing board.” Even more important to the longer-term count is to hold 1479 (the wave I’ high back in August). I remain out of the market.

Sunday 4 November 2007

Weekend Update for November 4, 2007


Even though we had a lower close week over week the cash S&P500 formed an uptrending price bar on the weekly chart higher. As shown in the chart we once again have found support at the confluence of the short (red) and medium (blue) moving averages. A new downward pulse began at this week’s high. Also of interest is that we continue to close at or above the lower of three Gann angles (shown in red on the chart) from the March 2007 low. The support identified in prices by these tools is critical as a failure to hold 1489 would be a bearish development. I expect it will hold.
If our Elliott Wave count is correct than we now have four waves up completed from the August low and have begun the fifth, which is subdividing. This week’s downward price pulse being associated with wave “2 of v”. The Fibonacci and Gann (green lines) targets derived from the weekly chart are shown and are unchanged from last week. Target ranges for wave “v” are 1597-1603, 1624-1627, and 1658-1665. I am also sticking with a guess of November 28 – December 7 for the end of “v”.
Bearish divergence remains in place on the weekly chart between price and all the momentum indicators I follow. This indicator of “trouble bubbling under the surface” was covered in yesterday’s post concerning the monthly chart. The only thing keeping this market up is “time”. In my work time is just not up for this bull.

Saturday 3 November 2007

Monthly Review October 2007

October ended up being an uptrending price bar on the cash S&P500 monthly chart with a closing price at new all-time highs. The price pulse is up from the fractal low and Change-In-Trend (CIT) at August’s low of 1370.6.
At the end of June 2007 (1503.35) the monthly chart gave a technical “sell” signal when the composite index failed to confirm the new May high in the RSI and both indicators turned down. Then, at the end of August (1473.99), the RSI registered a positive reversal with a minimum target of 1579.07. These two events mark waves 3 and 4 respectively (see chart). Since the positve reversal signal the market has reached 1576.09.
From an Elliott perspective there are only two possibilities from the October 2002 price low. We are either in a large wave “5” or a large wave “B”. If we are in a “5” then the sub-waves will be “1-2-3-4-5”; if in a “B” they will be “a-b-c”. I don’t have a firm opinion on which it is at this point but I do believe that we are near the end of the third sub-wave be it a “3” or “c”. Most likely the rally from the late 2002 low will be confirmed complete if we break the trendline joining the August 2004 and August 2007 lows. That trendline (slope of 8.608 per month) stands at 1396.4 this month. Another important trendline (slope of 2.48 per week) in my work joins the June 16, 2006 low and the August 17, 2007 low. It stands at 1397.91 right now.
From a technical viewpoint the market is starting to look wobbly due to very long term divergences. However; we won’t have an outright “sell” until either, 1) The positive reversal is negated; or 2) the RSI turns down. In other words we better close November above 1549 or we may be in deep trouble.
Bottom Line: Although danger may be building in this time frame, the market must be considered bullish on the monthly chart until it gives a clear signal otherwise

Friday 2 November 2007

Did Someone get the Number of that Truck?


Well that wasn’t pretty. We had a large downtrending bar in the cash S&P500 yesterday. The price pulse that began on Wednesday morning ended at the high Wednesday afternoon. The latest price pulse is down and has caused the 1552.76 high to become a Change-In-Trend (CIT) point. I was stopped out of the long SPY trade in my blog related Investopedia account. With that loss the annual return is now down to a positive 2.9%.
After reading the blog yesterday my wife asked “So tell me again why you went long at the end of five waves up?” I won’t go into the sordid details of how that conversation went, but suffice it to say that I wasn’t positive that the count was correct and certainly thought any decline would hold the 1530 area.
So what now? From the Frost and Prechter text “Elliott Wave Principle”, “Second waves often retrace so much of wave one that most of the profits gained up to that time are eroded away by the time it ends … at this point investors are thoroughly convinced that the bear market is back to stay.” If we are now in wave ii” (see chart) I would think that the 1503 level would hold (Fibonacci retrace level and long term moving average support). 1489 must hold or I am back to the drawing board.
Then there is this quote from yesterday’s blog “The only way I can be bearish over the short-term (next few days) is to count the move from the 10/24 low as a completed five wave impulse move. That would imply a pullback over the next two to three days. Even if this were to occur I still envision a move to new highs afterwards.” Believe it or not my work still has high odds on a large upward move from the low we make here.
Bottom line: The bulls must make a stand and hold 1489. A look at the monthly and weekly charts over the weekend. Stay safe.

Thursday 1 November 2007

Post FED Life


I am now long the SPY. My buy stop was at 154.45 but did not get filled until 154.91 and now the GLOBEX has the s&p’s down over 7 this morning. Sheesh …… what a life! My stop loss is at 152.83.
Another volatile FED day as we formed an outside price bar in the cash S&P500 on Wednesday. The price pulse downwards from the 10/29 high completed at yesterday’s low where a new upward pulse began. Yesterday I said that I was looking for a very quick and short pullback with a new move upwards into at least Friday if not early next week. So far so good.
After an upwards start to the day yesterday we sold off on the FED announcement but found support at the short (red) moving average and then rallied again. Here is one less worry for those of a bullish persuasion: the Derivative Oscillator has moved back cleanly across the zero line. There is no longer the risk of a “failure at the zero line”.
The only way I can be bearish over the short-term (next few days) is to count the move from the 10/24 low as a completed five wave impulse move. That would imply a pullback over the next two to three days. Even if this were to occur I still envision a move to new highs afterwards.

Wednesday 31 October 2007

The FED is in the house

We formed a downtrending price bar in the cash S&P500 on Tuesday. The price pulse upwards from the fractal low (blue diamond) and CIT (green circle) of 10/24 completed at 1544.67 where a new downward pulse began.

Today is circus day and like everyone else I will be watching the center ring at 2:15 Eastern Time. Regardless of that event, I was looking for a short-term low to occur at this point and yesterday’s downtrending bar fits the bill. The same timing work is pointing to this being a very quick and short pullback with a new move upwards into at least Friday if not early next week.

The only news I have on the technical front is that the market fell to the short (red) and medium (blue) moving averages I track while the Derivative Oscillator (not shown) has moved back to the zero line. One thing I don’t want to see is for the oscillator to fail here (turn back down). That would be a bearish event.

Is a tradable pull-back in place? For the purposes of this blog yes; we have had enough evidence that a new upward leg is in progress – a fractal low and CIT on 10/24. We have now had a hesitation in the trend and a move above yesterday’s high will resume the uptrend. For my blog related trading account at Investopedia (the No End competition) under the name of SaxbyFox, I will be putting in a buy stop for SPY shares at a price of 154.45. My initial stop (when filled) will be just under either today’s or yesterday’s low (whichever is lower). Using a stop of 152.86 (yesterday’s low was 152.87) I am exposing 1.58.
This theoretical account is worth $100,801. My Maximum trade share size must allow a risk for the trade, based on the stop loss, of no more than 0.5% of account equity. Therefore, for today’s trade: 100,801 account x 0.005 maximum loss = $504 maximum loss per trade. $504 / 1.58 stop = 319 share maximum.

Bottom Line: I am using yesterday’s pullback as a reference point to enter a long trade but I need the market to prove itself to me by taking out the latest swing high.

Tuesday 30 October 2007

Another Uptrending Bar


Yesterday saw the cash S&P500 form another uptrending bar. The price pulse upwards from the fractal low (blue diamond) and CIT (green circle) of 10/24 continues.
Yesterday I laid out some nearby Gann/Fibonacci clusters on the daily chart. The 1536-40 area doesn’t seem to have affected the market. However, a short-term low is due now and so I am still expecting some sort of hesitation in this upward run. It may only be a one day pullback or inside day but we should stutter step here. As always with the interplay between technicals and fundamentals, it is interesting to me that this low is due before the Fed announcement tomorrow.
Bottom Line: No change in the overall picture as I am still looking for an entry point to go long the SPY.

Monday 29 October 2007

In Search of Hesitation


Thursday’s uptrending price bar was not the strongest day in history. Friday, however, did produce a strong uptrending bar and the price pulse down into the 10/24 low is over. That low is now marked as both a fractal low (blue diamond) and a CIT (Change-In-Trend) by the green circle since the new price pulse upwards has exceeded the starting point of the previous downward pulse. CITs are very good at marking the end of price patterns, and it looks to me like the completed pattern is an “a-b-c” zigzag.
Yesterday I laid out some price targets; all of which were new all-time highs. The RSI (included on today’s chart) held the 40 level during the recent decline which is indicative of a market in a bull market – a market with the strength to reach new highs. I don’t suspect we will reach those new highs straight away. Or will we?
There are only two more Gann/Fibonacci clusters on the daily chart before new highs are reached: 1536-40 and 1565-68. We will be challenging the first level today. I actually hope we get a reaction so that I can get long. My developing trading system requires that at this point. The only issue for me is that I expect only a brief hesitation. I think the rally will resume quickly and last the rest of the week.
Bottom Line: At this point the price fractal low and Change-In-Trend (CIT) on 10/24 are just as good as a technical “buy” signal. I now need an entry point to go long the SPY.

Sunday 28 October 2007

Weekly Update October 28, 2007


The cash S&P500 formed another downtrending price bar on the weekly chart but closed higher. As shown in the chart we found support at the confluence of the short (red) and medium (blue) moving averages. This support coincided with that previously shown on the daily chart. This week’s price bar was a “Reversal Bar” and the price pulse downwards from the 1576.09 all-time high ended at 1489.56. A new upward pulse began at this weeks low. Finally, note that the all-time high is now a price fractal (marked by the small blue diamond).
We now have four distinct price pulses up from the August low and have begun the fifth. My best bet at an Elliott Wave count is that the completed pulses are associated with waves “i-ii-iii-iv” of a five wave impulse pattern that; when it ends, will be ending an even larger five wave movement. The Fibonacci and Gann (green lines) targets derived from the weekly chart are shown. Target ranges for wave “v” are 1597-1603, 1624-1627, and 1658-1665.
Timing, for me, is always harder than price. My best estimate at this point is November 28 – December 7.
In last weekend’s posting I spent a bit of time talking about the bearish divergence on the weekly chart between price and all the momentum indicators I follow. If we are now in wave v of an even larger fifth wave then these divergences will come home to roost when v of 5 ends (early December?). I will return to these divergences in each weekly post until they are resolved.
Bottom Line: Although trouble may be bubbling under the surface it appears that at least one more push to new highs is underway. For me, the tricky part will be to find a position to get long. More on that in Monday mornings post.

Friday 26 October 2007

Which way will she break?


Although the price bar from yesterday must be classified as “uptrending” it was not the strongest day in history. In fact, our swing indicator remained negative and so the price pulse down is still in effect from Tuesday’s high. It was also a Reversal Day since we made a new high but closed below the open and yesterday’s close. My stop was hit on SH during Thursday.
Note on today’s chart how the long (green) and medium (blue) moving averages contained the price action. My ongoing belief is that we made a short-term (or greater) low on Wednesday. If the market can exceed yesterday’s high today the odds become 50/50 that the move from 10/11 is over. If we can keep the rally going into early next week I will become even more convinced.The bearish case is that an a-b-c correction is not the correct interpretation from the high. That count would be a 1-2-3 with the last few days being wave 4. This Elliott count would require a move to new lows over the next few days.
Bottom Line: Still waiting for a technical “buy” signal, or even a price fractal low or Change-In-Trend (CIT) of the price pulses. On the sidelines for now.