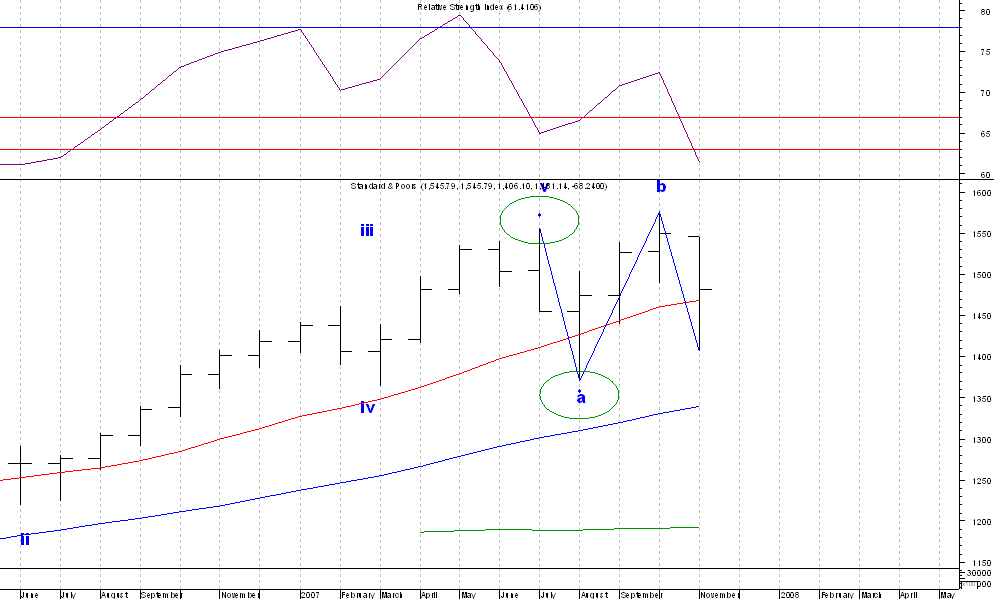
November ended up being a downtrending price bar on the cash S&P500 monthly chart. The price pulse up from the fractal low and Change-In-Trend (CIT) at August’s low of 1370.6 is confirmed complete at October’s high of 1576.09. This number is still short of the minimum target of 1579.07 produced by the positive reversal in the RSI at the end of August when the market stood at 1473.99. As of the end of November this reversal target is still in play.
Today’s chart shows that the monthly price bars continue to bounce along the short (red) moving average; the fierce rally of the last few days preventing us from ending the month below that short moving average. In fact, we haven’t closed below that average since the bull run got underway in earnest after the 2002 low.
At the end of June 2007 (1503.35), the monthly chart gave a technical “sell” signal when the composite index failed to confirm the new May high in the RSI and both indicators turned down. We have now reinforced that sell signal since the new all-time closing high in October was not accompanied by a new RSI high and both price and the RSI have turned down in November. Last month I wrote that “Although danger may be building in this time frame, the market must be considered bullish on the monthly chart until it gives a clear signal otherwise.”
Until the positive reversal is negated or the August low violated I think the bull is clinging to life on the monthly chart with at least one more new all-time high required.
No comments:
Post a Comment