Friday 24 June 2011

SPX Daily Chart - 23 June 2011


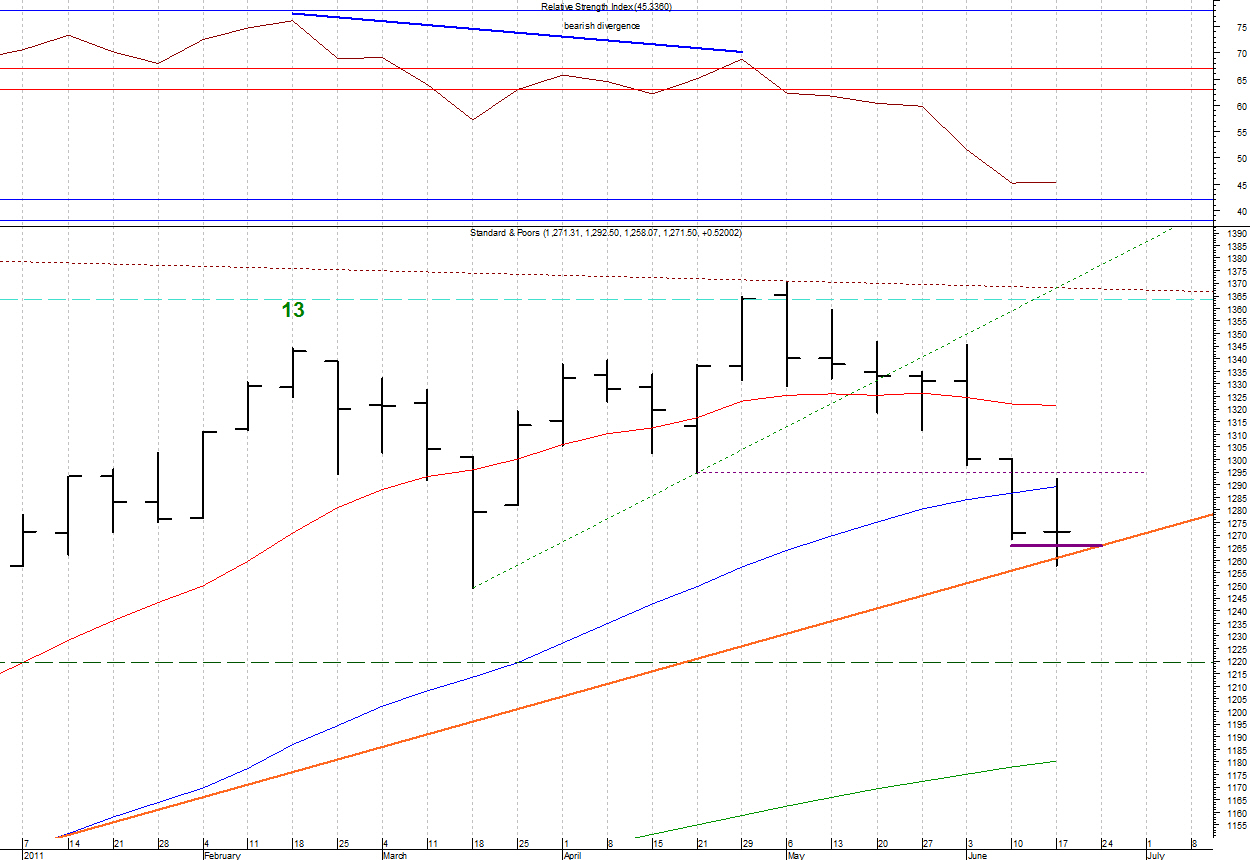
     An extremely volatile day! Supposedly Tom DeMark said that only two prices matter, the open and the close; everything else is just emotion. Well, after the dust cleared it can be said that both the open and close were above the short (red) moving average. We also held the recent lows. A successful retest? The bulls most likely think so, but now need to prove it. If yesterday morning's steep fall was just a pullback before prices resume moving higher then the next strong area of resistance on the daily chart is 1310-1316.
    Bottom Line: The allocation mix meter is at +50%. My near term scenario assumes that an intermediate term low is in and that a rally will now take us back above the 1344 level. However; I remain quite concerned that the rally high from the 2009 low was made on May 2. As such, any break below the March low of 1249.05 will cause me to lighten my position even further as the allocation meter would fall to +25%.

Thursday 23 June 2011

SPX Daily Chart - 22 June 2011


     After a brief dip at the open the cash SP500 market recovered to make a new rally high before moving sideways for 3.5 hours. The bears moved in late in the session and we sold off into the close, invalidating Tuesday's break of the supply line target and proving it to be (at least short term) resistance. Yesterday's high also marked the end of D.5 on the 15 minute chart and the end of the upward moving hourly D-Wave from the June 16 low. The question now: Did the late day sell off begin a move to new lows or is it just a pullback before moving higher?
     The hourly chart completed a sell setup at the high while breaking up through hourly TDST resistance at 1296.22. However, this was not a qualified break and we pulled back below that level before making another (and this time qualified) break upwards at 1 pm. However, the combination of completed D-waves, a sell setup and bearish divergence with the RSI were enough for the bears to gain control into the close.
     The fact that the sell setup sequence had a bar with a close above TDST resistance along with the validated break of TDST resistance itself lead me to believe that we will end up with just a pullback before price moves higher again. I will be watching the short (red) moving average to be a support area. If prices then resume moving higher the next strong area of resistance on the daily chart is 1310-1316.
    Bottom Line: The allocation mix meter is at +50%. My near term scenario assumes that an intermediate term low is in and that a rally will now take us back above the 1344 level. However; I remain quite concerned that the rally high from the 2009 low was made on May 2. As such, any break below the March low of 1249.05 will cause me to lighten my position even further as the allocation meter would fall to +25%.

Wednesday 22 June 2011

SPX Daily Chart - 21 June 2011


     The bulls were able to provide follow through to the upside in the cash SP500 yesterday. We rallied directly to the calculated target of the recently broken supply line and then stalled for the remainder of the day. However, the break of the target at 1295.31 was qualified.
     Although profit taking by traders is not unexpected after such a bullish day, there are signs that there may be more upside to come before this rally is ultimately over. Indications are that the D-Wave on the daily chart from the May 2 high is complete. Right now I am calling it D.A, which would imply that the move up from the June 16 low is D.B. It is coming off of a completed buy setup and bullish technical divergence.
     The next challenge to the bulls is hourly TDST resistance at 1296.22. Although we poked above it yesterday the break was invalidated at the close. Additionally, we will have to see if today's price action invalidates the breaking of our supply line target of 1295.31 on the daily chart. Since the hourly RSI is now indicating a bull trend I would have to view any pullback from here as just that, a pullback. If the rally continues over the coming days then the next strong area of resistance on the daily chart is 1312-1318.
    Bottom Line: The allocation mix meter is at +50%. My near term scenario assumes that an intermediate term low is in and that a rally will now take us back above the 1344 level. However; I remain quite concerned that the rally high from the 2009 low was made on May 2. As such, any break below the March low of 1249.05 will cause me to lighten my position even further as the allocation meter would fall to +25%.
     P.S. There may not be a daily posting tomorrow.

Tuesday 21 June 2011

SPX Daily Chart - 20 June 2011


     The cash SP500 has continued to struggle higher over the past two sessions. The low last Thursday was above the risk level (horizontal dashed cyan line at 1254.24) of the recently completed daily buy setup where we had bullish divergence between price and the technical indicators I track.
     The bounce from the low has been less than impressive. After a qualified break of the Supply line (dashed red line) on Friday the market backed off and closed below it; which is weak price action. Not to be deterred the bulls opened the market back above the line yesterday (a qualified break) and this time were able to close above it - a better sign of strength. The calculated target of this supply line break is 1295.31 and is indicated on the chart. To reach that target the bulls must first clear the short (red) moving average which will be at about yesterday's high today. Let's see if we get any follow through to the upside today.
    Bottom Line: The allocation mix meter is at +50%. My near term scenario assumes that an intermediate term low will be made above the March low and that a rally will then take us back above the 1344 level. However; I remain quite concerned that the high may already be in for the rally from the 2009 low. Any break below the March low of 1249.05 will cause me to lighten my position even further as the allocation meter would fall to +25%.

Monday 20 June 2011

Investigations - Part 1


     Lately I have been investigating the D-wave; trying to wrap my brain around the unique framework it provides. Let's consider the wave structure from the hourly bar chart of the cash SP500 which is displayed in the attached chart. The hourly D-waves are plotted on the daily bar chart.
     Perhaps the key to using this data is to focus on the fact that the end of three (A-B-C) or five (1-2-3-4-5) wave swings are potential exhaustion areas. Next we make the assumption that the next higher time frame chart is a 'forcing' mechanism. That is, you only want to take positions that are in sync with the next higher time frame. Since Combo, Setup and Sequential are also designed to identify exhaustion areas it makes sense to see how they all interact.
     To start, take this groundwork: The yearly DJIA D-wave count can begin at the 1932 low since it is a 21 period low. From that starting point D1 ended at the 1966 high and D2 at the 1974 low. As of today we still don't have confirmation that D3 has ended. Note that these waves could be labeled DA, DB, and DC. What is the deciding factor? The trend. The price action since 1932 (on a yearly basis) is certainly not a counter-trend (corrective) move.
     To Be Continued ....

SPX Weekly Chart - 17 Jun 2011


     With last week's downtrending price bar the weekly D-wave count now shows the possibility that the entire rally from the March 2009 low is complete. We recorded a sequential sell countdown bar #13 on February 18. After such a signal it is advisable to allow up to twelve weeks for a change in trend to develop. On weeks 10 & 11 there was a false breakout to the upside and then the current decline started on week 12. The failure to continue the uptrend past week 11 was accompanied by a bearish RSI divergence.
      Note that last week's low touched the uprtrend line drawn across the March '09 and July '10 lows. It also fulfilled the TD Trend Factor target (1265.68) and confirmed the break below the medium (blue) moving average. All in all the picture is quite negative on this timeframe.
     The immediate battle will be over the already mentioned Trend Factor target and long term trendline, which are essentially at the same price this week. The bears want to close the market below this level on a weekly basis. They also want the weekly RSI to drop below the bull market support zone (38-42). In order to launch a counter attack the bulls want to close above those same levels. However, without at least a sequential buy setup appearing (which would take at least four more weeks) it looks like any bullish counter attack will be just that - a counter trend rally within a larger bearish decline.
    Bottom Line: The allocation meter is at +50%. If meeting the long term trendline and the Trend factor target are not enough then the March low is the next target. Any break below the March low of 1249.05 will cause me to lighten my position even further as the allocation meter would fall to +25%.
     P.S. I will be starting a new series today in addition to my regular postings. It will be focused on D-Wave studies but also cover combo, sequential and setup.