Friday 11 February 2011

SPX Daily Chart - 10 Feb 2011

     We are now at bar eight of a potential 9-13-9. In order to reach 9 we must close today above 1319.05. Meanwhile, a close below 1324.3 would certainly keep the weekly Combo sell countdown in play.
     Another aspect of potential trend exhaustion is reflected in how some of the other technical indicators are behaving. Today's chart shows the Relative Strength Indicator (RSI) along with the price chart. The bearish divergence is obvious.
     Bottom Line: Although the indicators are pointing towards trend exhaustion they are still bullish at this moment.

Thursday 10 February 2011

Wednesday 9 February 2011

Tuesday 8 February 2011

SPX Daily Chart - 7 Feb 2011

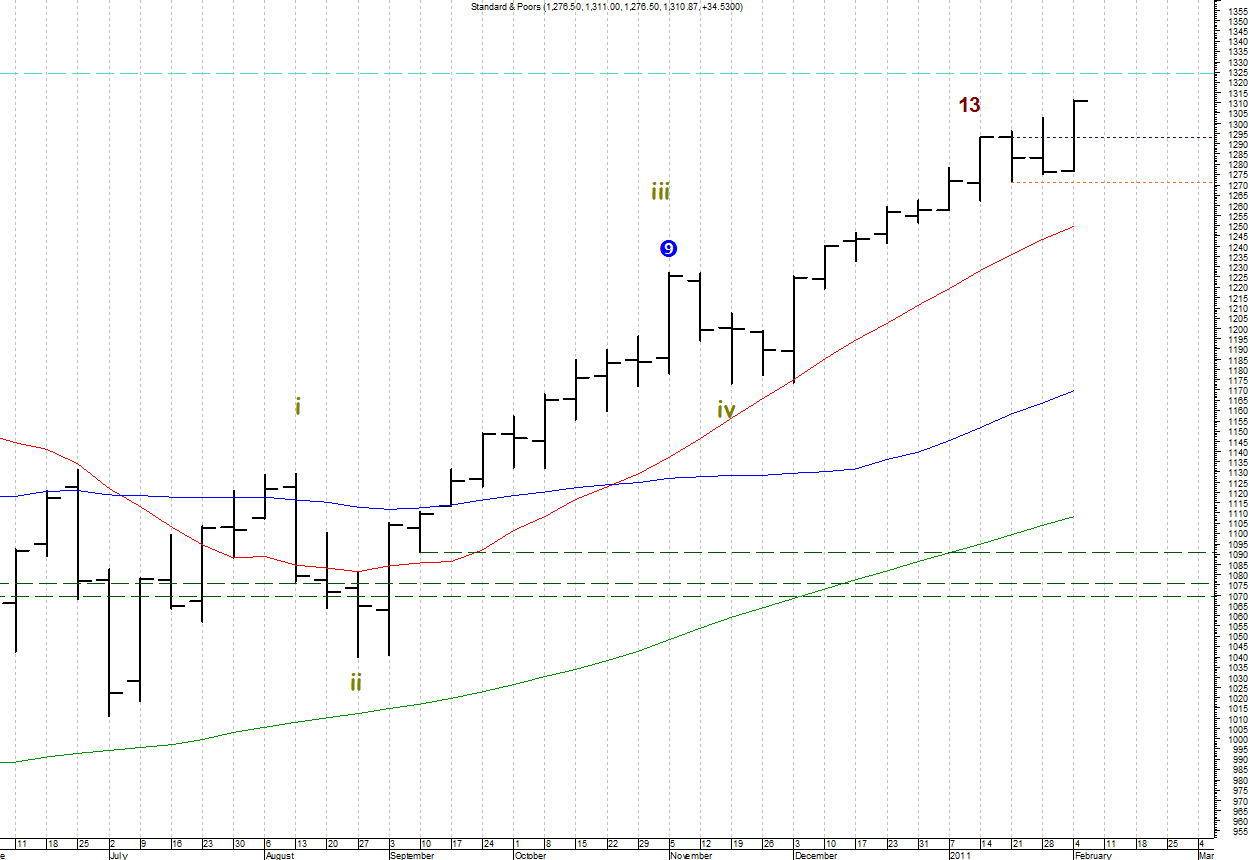
     While we note the ongoing bullish position of the higher level time frame charts it is time to quickly update the daily chart (shown above). Last time it was pointed out that the daily chart should be monitored for wave 5 completion. At this point that would take a move below the 1275.1 level. The wave 2/4 trendline is shown as this is a typical line to watch in elliott wave work.
     Today I also did a few fibonacci calculations for the current D-Wave structure. Note the tight cluster just under the 1335 level. 1333.58 is twice the 2009 low. The other two lines are based on the lengths of waves one and three from the July 2010 low. Just for fun: 1333 is a 120 degree angle on the Gann square of nine chart. 664 is zero degrees.
     Finally it must be noted that we are sitting at setup bar five of a potential 9-13-9 sequential reinforcement pattern. If the sequence were to continue we would hit bar nine this Friday.
     The daily price pulse chart would signal an early warning of a possible trend reversal should we break below the horizontal dashed line noted at 1294.83.
     Bottom line: As of now the daily chart, like those of higher time frames, remains in a bullish position.

Monday 7 February 2011

SPX Weekly Chart - 4 Feb 2011

     As shown last week the monthly, weekly, and daily charts are all in a bullish position. What would turn them negative? On the weekly chart (shown above) we are waiting for a weekly price flip (close less than the close 4 weeks ago) to trigger the combo 13 bar. This week that level (horizontal dashed purple line) stands at 1293.24. In the meantime, recall that a daily chart move below the 1271.26 level (horizontal dashed orange line) would indicate that wave 5 is complete on the daily chart. This level also turns out to be a weekly price pulse confirmation point.
     Bottom Line: My work indicates that the weekly chart would need to print below 1271.26 this week (and close below 1293.24) before it can be deemed bearish.