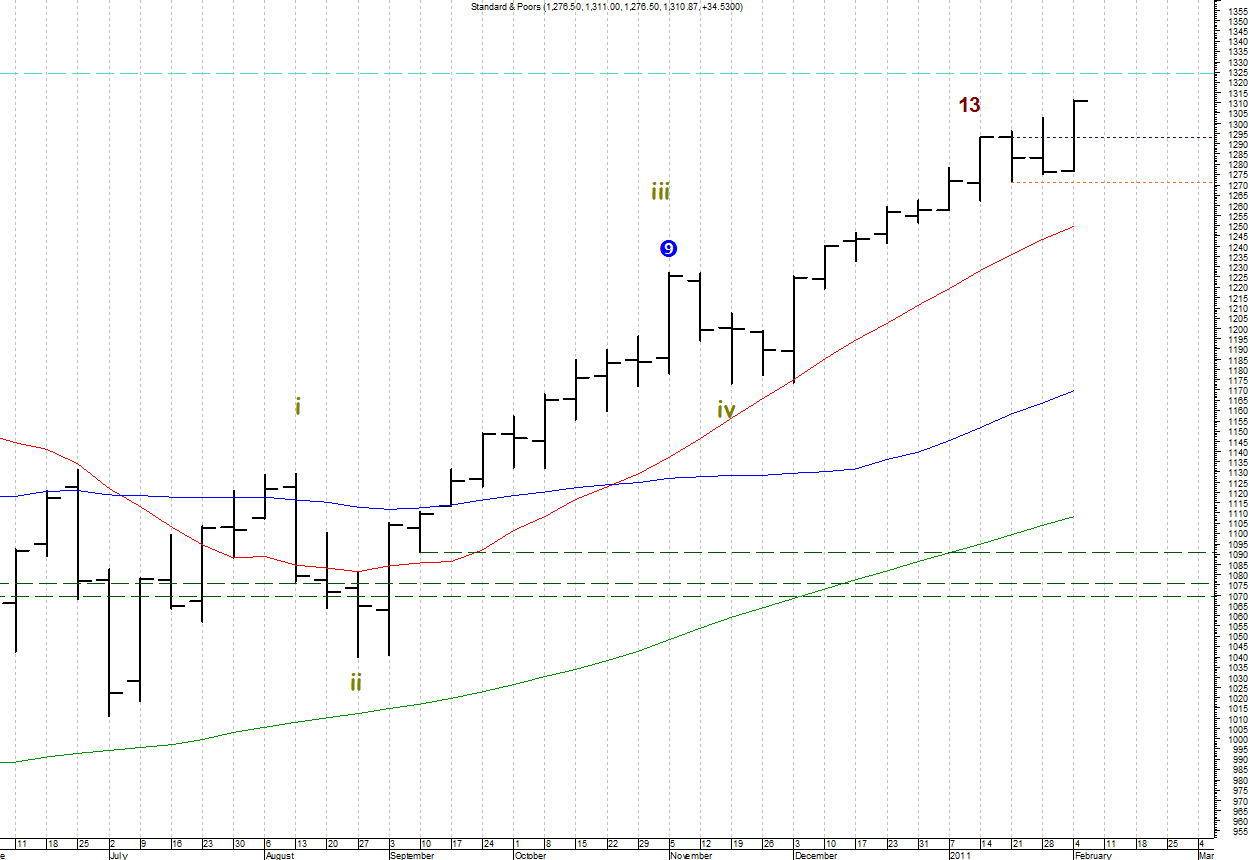
As shown last week the monthly, weekly, and daily charts are all in a bullish position. What would turn them negative? On the weekly chart (shown above) we are waiting for a weekly price flip (close less than the close 4 weeks ago) to trigger the combo 13 bar. This week that level (horizontal dashed purple line) stands at 1293.24. In the meantime, recall that a daily chart move below the 1271.26 level (horizontal dashed orange line) would indicate that wave 5 is complete on the daily chart. This level also turns out to be a weekly price pulse confirmation point.
Bottom Line: My work indicates that the weekly chart would need to print below 1271.26 this week (and close below 1293.24) before it can be deemed bearish.
6 comments:
Why doesn't the weekly sell setup that just completed on the S&P last week force the weekly 13countdown to begin again?
Hi. You are correct that the weekly just completed another sell setup on the cash SP500 chart. However, as I implement sequential and countdown, the new setup does not meet my chosen recycle criteria. Specifically, the new setup must be greater than 100% but less than 161.8% of the active setup (this is analyzed using true highs and true lows).
Certainly one can use other criteria for what constitutes a recycle; the "system" is subjective in that sense.
Hope that answers the question.
Thanks for the reply, Saxby.
So we are waiting for the weekly combo 13 to become activated by a close lower than 4 price bars earlier (1293) right? How long do we wait for that to occur before we would switch to last week's completed sell setup as the active series?
That's the trouble I have interpreting Demark. What happens when the combo 13 bearish price flip doesn't occur?
-Erik
You are welcome Erik. While waiting for the price flip the first thing to watch for is a close above the risk level (1324.3). That is the cyan dashed line on the chart. If we close above that level on Friday and then confirm the break the following week then we switch to the new setup.
Saxby
Thanks for the explanation.
Let's say we close above 1324.3 this week. What would constitute a confirmation of an upside break next week? Would next week have to close above 1324.3 or simply open above 1324.3?
-Erik
Erik - Here is my criteria to disqualify any close above the risk level this week.
Disqualification occurs if next week's price bar:
-- opens below 1324.3 OR
-- opens below this week's closing price AND the high next week fails to exceed the high of this week.
Saxby
Post a Comment