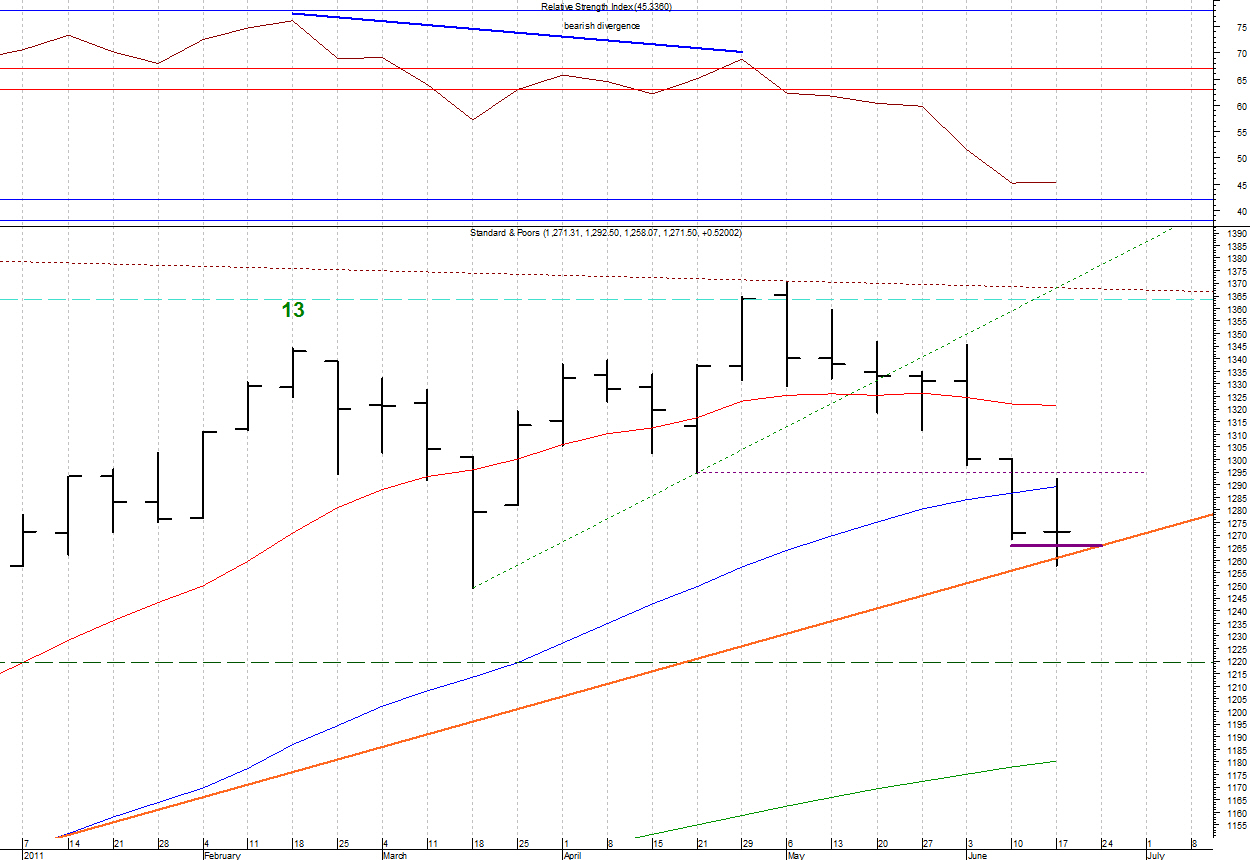
With last week's downtrending price bar the weekly D-wave count now shows the possibility that the entire rally from the March 2009 low is complete. We recorded a sequential sell countdown bar #13 on February 18. After such a signal it is advisable to allow up to twelve weeks for a change in trend to develop. On weeks 10 & 11 there was a false breakout to the upside and then the current decline started on week 12. The failure to continue the uptrend past week 11 was accompanied by a bearish RSI divergence.
Note that last week's low touched the uprtrend line drawn across the March '09 and July '10 lows. It also fulfilled the TD Trend Factor target (1265.68) and confirmed the break below the medium (blue) moving average. All in all the picture is quite negative on this timeframe.
The immediate battle will be over the already mentioned Trend Factor target and long term trendline, which are essentially at the same price this week. The bears want to close the market below this level on a weekly basis. They also want the weekly RSI to drop below the bull market support zone (38-42). In order to launch a counter attack the bulls want to close above those same levels. However, without at least a sequential buy setup appearing (which would take at least four more weeks) it looks like any bullish counter attack will be just that - a counter trend rally within a larger bearish decline.
Bottom Line: The allocation meter is at +50%. If meeting the long term trendline and the Trend factor target are not enough then the March low is the next target. Any break below the March low of 1249.05 will cause me to lighten my position even further as the allocation meter would fall to +25%.
P.S. I will be starting a new series today in addition to my regular postings. It will be focused on D-Wave studies but also cover combo, sequential and setup.
No comments:
Post a Comment