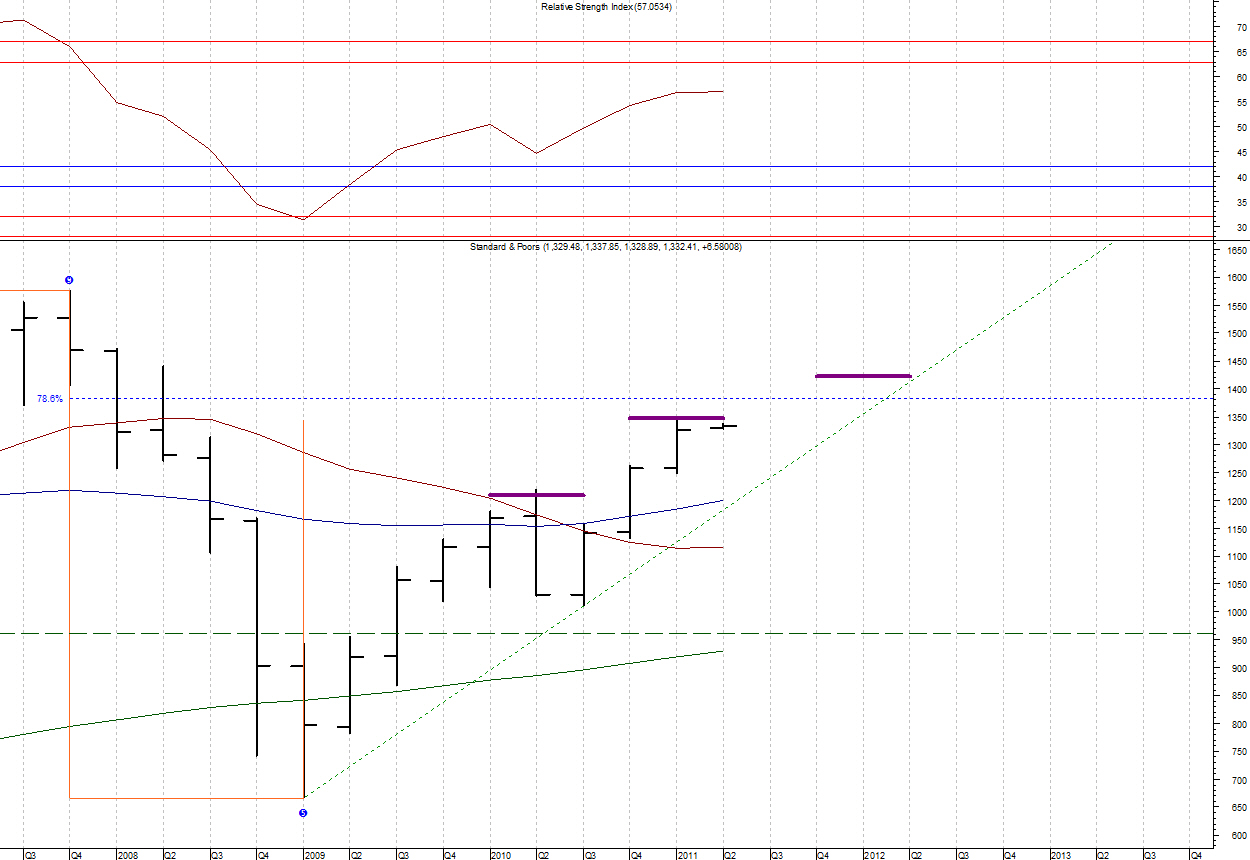
As the price decline from the 2007 high made a qualified break of TDST Support in late 2008 (the dashed green horizontal line at 960.84), the trend is down. Additionally, when the RSI indicator (top pane) is used as a trend indicator we can see that a bear market was signaled at the same time when the area reserved for bull market support (parallel solid blue lines) was broken. Putting these two facts together implies that the rally from the 2009 low is most likely corrective in nature; particularly since the RSI is still under the area reserved for bear market resistance (parallel solid red lines).
A corrective rally can be quite substantial, and recall in the last quarterly review that the quarterly price pulse is bullish. Combine that with the fact that corrective Elliott "B" waves can go to new highs, and it means that the rally still may have room to run higher. In fact, the only immediate concern on this chart is that we are at a TD Trend Factor target (purple line). Notice that the decline from April - July 2010 occurred from such a previous target.
Bottom Line: The quarterly chart analysis should be used as background for the lower time frame charts. I will take a look at the new Monthly chart tomorrow.
No comments:
Post a Comment