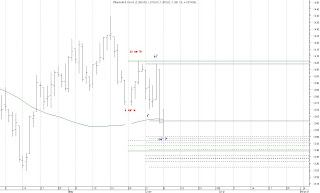
 Although we closed higher, Thursday is classified as a “downtrending” day in the cash S&P500 index. Low yesterday was at the 1331 Fibonacci cluster mentioned yesterday. 1331 is 180 degrees from 1405 on the Gann wheel. Given the price action yesterday the odds are now raised that a five wave impulse pattern has completed from the June 5 high. Caution is called for; however, since the daily, weekly and monthly charts are all on “sell” signals. The decline from May 19 is not over.
Given the assumption that an impulse pattern has just completed, it must be put into a larger context as being wave c or iii from the May 19 high. The most bearish interpretation is the latter alternative (an impulse wave from May 19), where we just have a short, contained bounce. In this case wave iv should find resistance near the long (green) moving average in the fourth wave area of one less degree. In the more bullish scenario (where we just completed a zigzag from May 19) we can get a bit more drawn out, choppy rally back towards the 1400 level. In both events we would then decline to below the 1331 level.
My roadmap through the end of July is shown on the attached chart. In it we have made low (or will at slightly lower levels if the move from May 19 turns out to be an impulse) and then get a choppy rally into the end of the month. This rally will fail below 1406 and a move to retest the January and March lows will ensue. We may get a new low in the DJIA but I believe the S&P500 will hold and make bottom around 1290 in mid-July. A much more significant rally will then be possible.
Bottom line: I am bearish through (at least) July but let’s see what the market gives us.


