Saturday, 16 May 2009

Weekly Update

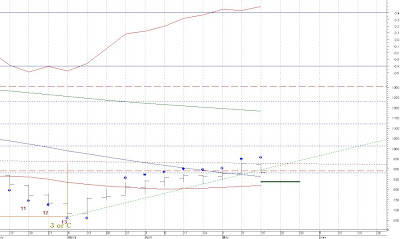
A downward trending week on the cash S&P500 has triggered several negative events. After breaking through TDST Resistance at 890.4 the week ending May 8, the break was not qualified as we failed to make a higher high this week. The S&P also negated the previously in-force TD Supply line bullish price objective by breaking below the TD Demand line this week at 895.42. We will qualify a price projection to 837.81 by breaking below 878.94 next week.


The weekly TD REI (top pane of today’s chart) signaled a “sell” by dropping through 879.21.


Bottom Line: I believe that a deep retracement of the rally from March 6 has begun, but continue to think that the lows for the year (though perhaps not the bear market) are in.

Friday, 15 May 2009

Not Much New To Add Today

Odds now greatly favor that the L1 Beta pulse completed at yesterday’s low in the cash S&P500. We are now bouncing higher in a Delta pulse. A lower low today (without being part of an outside day that closes higher) will be a bearish development. All eyes are on the current bounce to see if it can reach for new highs; which will tell us a lot about whether the bull run from March 6 is truly well and done.


The experimental trade position remains short from 897.34; stop & reverse at 930.17.

Thursday, 14 May 2009

From Where Do We Bounce?

The cash S&P500 formed a downtrending price bar Wednesday as the L1 Beta pulse continues to unfold. From a timing perspective Beta has a 72% chance of completing by the end of today, so it is time to watch for a bounce. Whether that bounce can reach for new highs or not will tell us a lot about whether the bull run from March 6 is truly ended.


The first support level beneath the market is at 878. Below that 868-870; this encompasses the 23.6% Fib retracement and old TDST resistance. 870 is also in opposition to the 930 high. Then note the medium moving average at about 860 and the TDST support line at 847.


Even if the move up from March 6 eventually goes to new highs we have additional evidence that the first swing has topped -- the fact that yesterday closed at a level less than the close 7 bars ago. This is a TD Wave technique. The experimental trade position remains short from 897.34; stop & reverse at 930.17.

Wednesday, 13 May 2009

Level 3 Beta Price Pulse Underway

Tuesday saw another downtrending day in the cash S&P500 which caused Monday’s high to become a price fractal and cemented the view that the L1 Alpha pulse high is in. The move below 897.34 put the blog’s draft trading system short. The move down yesterday also fulfilled the TD Demand Line target of 898.99; after which we promptly rallied back towards the opening price.


The bounce underway from yesterday’s low is not unexpected as we have closed below the TD Channel (shown on today’s chart) for two days running. Of course, if the bull has been gored we should expect the previous high to hold. A move through the TD Supply line at 929.70 would be qualified and turn the short-term picture back to bullish.


On the bearish side our first support level is again in the 895-899 area. Below that 868-878; which encompasses the 23.6% Fib retracement; old TDST resistance and the first downside TD Propulsion factor target. 870 is also in opposition to the 930 high.

Experimental trade position: Short from 897.34; stop & reverse at 930.17.

Tuesday, 12 May 2009

Bears Need to Break 897

Is the L1 (Level 1) Alpha pulse high in? The odds favor that interpretation after yesterday’s downtrending price bar. However; the key continues to be the fact that we can’t have a significant high unless we break below last Tuesday’s low of 897.34.


Technically the biggest changes on the chart concern the TD Supply and Demand Lines. The TD Demand Line mentioned yesterday was broken and qualified at 918.99. That price action not only negated the TD Supply line target of 943.17 but gives us a downside target of 898.99. Keep in mind that this doesn’t mean the market can’t go lower. Otherwise, the new TD Supply line runs just under the previous highs.


Here is a full update of the current Draft Trading Plan:


Trading Philosophy (draft): The objective is to develop a mechanical trading system based on technical analysis and market cycle ideas. The system will have zero reliance on user input (i.e. a forecast or belief about future prices).


The success of the market cycle trades will depend on the size of the cycle. These are not predictable and so it is certain that some trades will lose money.


Technical analysis trades will only be taken in the direction of the current market cycle.


Trading Plan (draft):


The first objective is to protect and preserve capital


Every open trade must have an open protective stop-loss order


Never add to a losing position


Trend-Continuation Trade-Entry

Trend continuation trades will be taken on qualified breaks of TD Supply and Demand Lines. A trade can only be taken in the direction of the current Level 3 Price Pulse. These are the trades based on technical analysis. The maximum number of trend-continuation positions that may be held at any given time is two.


Trend-Reversal Trade-Entry

Trend-reversal trades will be taken when a new Level 3 Price Pulse begins. These are the trades based on market cycles. Only initiate a trend-reversal trade-entry when the market has signaled that the current Level 3 Price Pulse has completed and that a new Pulse (in the opposite direction) has begun. There can only be one trend-reversal position held at any given time. This trade strategy is essentially a stop and reverse strategy.


Trading Rules (draft):

Money Management

Trend-reversal trades: 40% of available account balance.

Trend-continuation trades: Each may be 20% of available account balance.


Position Risk

Each trade may only risk 3% of trade equity.


Position Size

This is determined as follows:

1) Money Management size = .4 X Account balance; or .2 X Account balance (depending on trade type)

2) Calculate the points at risk: the difference between the entry price and the initial stop-loss price.

3) Position Risk: Result from step 1 X .03

4) Position Size: Divide the result is step 3 by the result in step 2 and round down.

5) Dollar Amount for trade = result from step 4 X Entry Price


Example. $10,000 account balance. System indicates a Trend-reversal trade with entry price of 89.734; stop-loss level at 93.017.

1) 10000 x .4 = 4000

2) 93.017 – 89.734 = 3.283.

3) 4,000 x .03 = 120.

4) 120/3.283 = 36.551 rounded to 36

5) (36 x 89.734) = 3230.43


Trend-Reversal Trade-Entry

Trend-reversal trades are only made on those days; and at that price level, that confirm a new Level 3 price pulse has begun.


Initial Stop-loss on Trend-Reversal Trade

The initial protective stop-loss for this trade will be the most recent high or low.


Subsequent Stop-loss on Trend-Reversal Trade

The protective stop-loss will be brought to no further than one tick beyond the most current Level 2 Price Pulse high or low.


Trend-Reversal Trade-Exit

The trade is exited on a confirmed reversal in the Level 3 Price Pulse.


Trend-Continuation Trade-Entry

Trend-continuation trades are only made on those days that a TD Line in the direction of the current Level 3 Price Pulse is broken and qualified. The initial protective stop-loss for this trade will be the previous day’s high or low.


Trend-Continuation Profit Objective

This is calculated by using the TD Supply and Demand Lines


Subsequent Stop-loss on Trend-Continuation Trade

There are two trailing stop-loss levels.

1) Trailing Stop: 3-day high or low. Once the Price objective is reached use the 1-day high or low.

2) Current TD Demand/Supply line level contrary to the current trade


Trend-Continuation Trade-Exit

The trade will be exited at the protective stop-loss level.
Monday, 11 May 2009

Waiting on Alpha

The L1 (Level 1) Alpha pulse kept grinding higher on Friday as an uptrending price bar was made in the cash S&P500. Nothing has changed in the fact that we won’t have “proof” that a significant high is in until we break below last Tuesday’s 897.34 low.


Last Wednesday saw a TD Combo Sell Setup and the following day the trigger of a TD REI “sell” signal when 903.95 was broken. In my view both of those Tom DeMark warnings are still active until 936.76 is broken (the true range of Wednesday’s bar added to Wednesday’s high). Also of continued interest: 929 is trine the March 6 low in price. In time, 929 is square May 8. The high so far is 930.17.


There is a new TD Demand Line in play (see chart) that sits at 918.99 today. Break that level and not only will that line be qualified, but the currently in force TD Supply line target of 943.17 will be negated.


Draft Trading Plan: I think I will use a different stop loss method on future trend-continuation trades; more on stops just below. The core of the “system” is the trend-reversal trade. Both trade ideas are completely divorced of the need to forecast market prices and will be mechanical. A short position would be taken on a move below 897.34 today. All such trades are hypothetical (based on the cash S&P 500; not a tradable contract) and do not constitute advice to buy or sell any instrument. Initial stop would be placed at the most recent high.


As far as stop loss levels go, I am leaning towards letting them “drive” position size after setting money management rules that allow a risk of no more than 3.0% of account equity. For example, on the theoretical pending short trade above, the risk would be set at 3.283 points (using 1/10 the value of the cash S&P500 and a stop at the current high). If the account was worth $10,000 we have a situation where $10,000 x 0.03 yields a maximum loss of $300 allowed on the trade. $300.00 / 3.283 stop = 91.3798; rounded to a 91 share position. The practical result is that 82% of the account is used to “bet”. If 82% is deemed to high for individual tolerance it could be capped at a more comfortable figure. This will be my preference ... if only to keep funds available for possible coincident trend-continuation trades.

Sunday, 10 May 2009

Weekend Blurb

The rally from the March low continues. Last weekend I described five technical ideas that would/could “… lead to the weekly chart pointing to a pullback.” None of those events occurred. The up trend up must be respected until concrete evidence appears.


Enjoy the rest of the weekend while you ponder my latest Elliott wave count of this rally.